This section provides a glimpse on how to obtain images, exposure maps, source catalogues and source products from a given set of calibrated event files. The following flow chart shows the main eSASS tasks that help to achieve this:
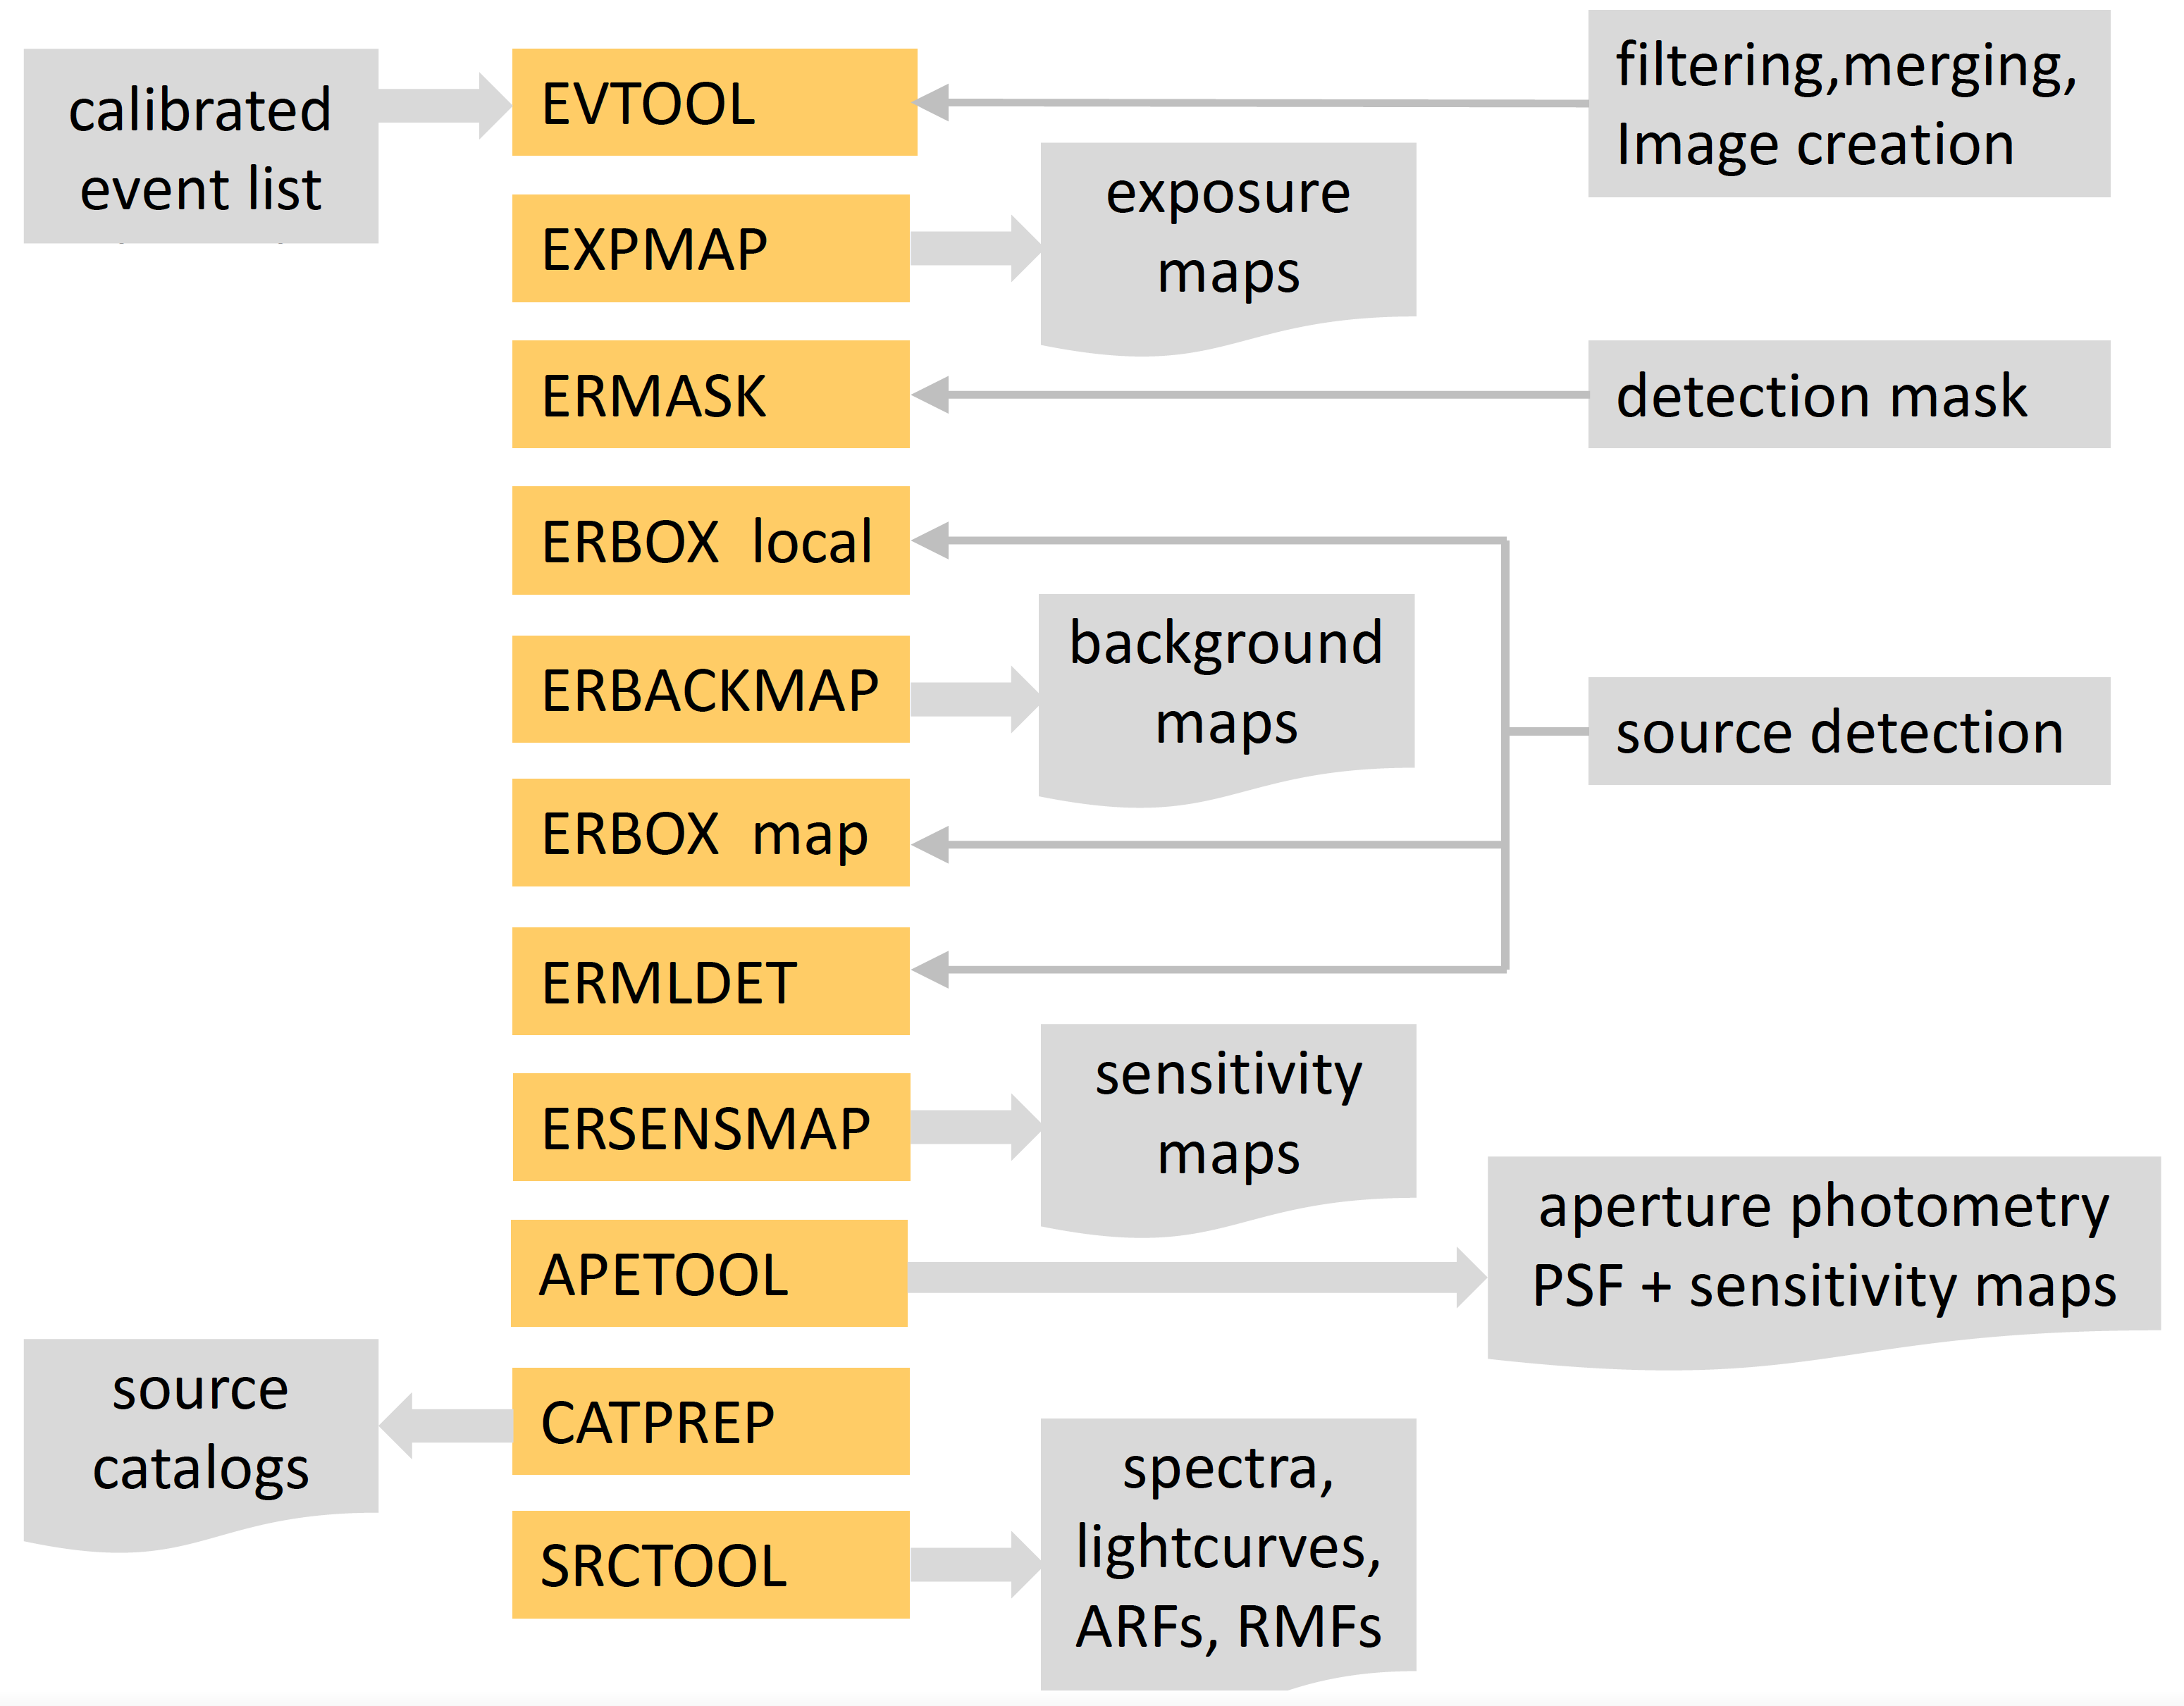
In the following, a step-by-step example of how to obtain source catalogues and products is shown. The example uses the default values for each eSASS task, and not all the task options are shown. For more specific requirements refer to the individual task pages.
1. evtool merges the input event files and creates an image in a given energy band:
 $ evtool eventfiles="events1.fits events2.fits ... events7.fits" \
	  outfile="events_image_comb.fits" image=yes emin=0.5 emax=2.0
The output file events_image_comb.fits will have events and image extensions.
2. expmap computes the exposure map in a given energy band:
 $ expmap inputdatasets="events_image_comb.fits" emin=0.5 emax=2.0 \
          templateimage="events_image_comb.fits" mergedmaps="output_expmap.fits"
See further remarks on the usage of expmap in this topic.
3. ermask creates a detection mask for the eSASS source detection chain:
$ ermask expimage="output_expmap.fits" detmask="detmask.fits"
4. erbox in local mode is the first step on the eSASS source detection chain.
 $ erbox images="events_image_comb.fits" boxlist="boxlist_local.fits" emin=500 emax=2000 \
	 expimages="output_expmap.fits" detmasks="detmask.fits" bkgima_flag=N ecf=1
Note that bkgima_flag=N since the background map is created in the next step. An energy conversion factor (ecf) is necessary for erbox to run.
5. erbackmap creates a background map by masking sources detected by erbox:
 $ erbackmap image="events_image_comb.fits" expimage="output_expmap.fits" \
	     boxlist="boxlist_local.fits" detmask="detmask.fits" bkgimage="bkg_map.fits" emin=500 \
	     emax=2000 cheesemask="cheesemask.fits"
6. erbox in map mode is the second step on the eSASS source detection chain:
 $ erbox images="events_image_comb.fits" boxlist="boxlist_map.fits" expimages="output_expmap.fits" \
         detmasks="detmask.fits" bkgimages="bkg_map.fits" emin=500 emax=2000 ecf=1
7. ermldet characterise the detected sources and determines source parameters:
 $ ermldet mllist="mllist.fits" boxlist="boxlist_map.fits" images="events_image_comb.fits" \
	   expimages="output_expmap.fits" detmasks="detmask.fits" bkgimages="bkg_map.fits" \
	   extentmodel=beta srcimages="sourceimage.fits" emin=500 emax=2000
Note that the extended model can be either Gaussian or Beta, depending on the user necessities.
8. catprep converts the output of ermldet into the catalogue file format:
$ catprep infile="mllist.fits" outfile="catalogue.fits"
9. srctool derives source products (spectra, light-curves and corresponding instrumental files):
 $ srctool eventfiles="events_image_comb.fits" todo=ALL srccoord="catalogue.fits" \
           srcreg='fk5;circle * * 60"' backreg='fk5;annulus * * 90" 120"' clobber=yes
In this case, srctool will extract all types of source and background products for all detected sources in the catalogue.fits file.
2.1 How can I list the options of an eSASS task?
Using the plist command will give you the list of options that a given eSASS task can take, for example:
$ plist evtool
2.2 How to merge various event files?
evtool merges the input list of the file names or such list can be given in a text file:
$ evtool eventfiles="events1.fits events2.fits ... events7.fits" outfile="events_comb.fits"
or
$ evtool eventfiles="@filelist.txt" outfile="events_comb.fits"
2.3 How to create an image from an event file?
evtool creates images in a given energy band, with certain rebin and size from an input event file:
 $ evtool eventfiles="events.fits" outfile="events_image_comb.fits" emin=0.5 emax=2.0 \
	  image=yes rebin=80 size=3240
If the option events is not turned off, i.e., events=no, the events_image_comb.fits file will contain both image and events extensions.
2.4 How to re-centre a merged event file (and therefore its corresponding image)?
If a merged event file has been created using evtool (e.g. by merging several sky-tiles), one can use the radec2xy task to re-centre the merged file around the desired position:
$ radec2xy mergedfile.fits XXX.X YYY.Y
where XXX.X is the right ascension in deg, and YYY.Y is the declination in deg.
Note that radec2xy works only with event lists, not with images.
2.5 How to create an event file from a given region?
evtool can filter an input event list according to a specified region (file or expression):
$ evtool eventfiles="events.fits" outfile="events_image_comb.fits" region="fk5;circle(90,23,1.2)"
or
$ evtool eventfiles="events.fits" outfile="events_image_comb.fits" region="regionfile.reg"
The region files must be created before calling evtool with your favourite text editor, and it must contain one region per line.
Note that evtool in eSASS4DR1 only accepts the radius (or size) of the region in decimal degrees, without extra characters. For example, if you want to
extract a region with a radius of 30 arcmin, you should write 0.5, not 0.5d or 30'.
2.6 How to extract an event file using good time intervals (GTIs)?
evtool can filter an input event list according to a specified time range (STDGTI extension or time range):
$ evtool eventfiles="events.fits" gti="TSTART TSTOP" outfile="events_filtered.fits"
where TSTART is the beginning of the GTI and TSTOP is the end of the GTI in seconds. TSTART and TSTOP values must be covered by the used observation.
2.7 How does the event flagging system work?
The FLAG values can store 32 bits of information. It is easier to visualise them in binary, for example:
0xc00f7f30 translates to 0b 1100 0000 0000 1111 0111 1111 0011 0000
whereas
0xC0040010 translates to 0b 1100 0000 0000 0100 0000 0000 0001 0000
When used as a selection mask in evtool, the effect is that any event which has at least one of the bits in its FLAG will be discarded. The bits are assigned to various problems and conditions.
In the examples above, the first one discards many more events than the second. Both will get rid of events that have the following bits set:
 BIT_TRAILING_EVENT         =  4
 BIT_PRECEDING_MIP          = 18
 BIT_CORRUPT_EVENT          = 30
 BIT_CORRUPT_FRAME          = 31
Note that to work out the bit number, you begin at the right-hand edge of the binary number, call that position bit 0, and then work left. Doing this, you see that the first bit of 0xC0040010 which is set is the 4th bit. The top selection, 0xc00f7f30, in addition, will discard events that have the following bits set:
  BIT_NEXT_TO_BORDER         =  5
  BIT_NEXT_TO_ONBOARD_BADPIX =  8
  BIT_NEXT_TO_BRIGHT_PIX     =  9
  BIT_NEXT_TO_DEAD_PIX       = 10
  BIT_NEXT_TO_BADCOL         = 11
  BIT_ON_FLICKERING          = 12
  BIT_ON_BADPIX              = 13
  BIT_ON_BADCOL              = 14
  BIT_OUTSIDE_QUALGTI        = 16
  BIT_OUTSIDE_GTI            = 17
  BIT_PRECEDING_MIP          = 18
  BIT_MIP_ASSOCIATED         = 19
All the available FLAGS are described here.
2.8 How to extract a light-curve of a point source?
One of the source products from srctool is a light curve (todo="LC LCCORR" option), for example:
$ srctool eventfiles="events.fits" exttype="POINT" srccoord="fk5;99.0,-20.0" todo="LC LCCORR"
The option srccoord should include the coordinates of the source of interest within the observation. One can choose the instrument (insts option), the binning (lcpars option), energy range (lcemin and lcemax options), etc.
2.9 How to extract a spectrum/ARF/RMF for a point source?
srctool can extract the spectrum of a point source (exttype="POINT"):
$ srctool eventfiles="events.fits" exttype="POINT" srccoord="fk5;99.0,-20.0" todo="SPEC ARF RMF"
2.10 How to extract a spectrum/ARF/RMF for an extended source?
srctool can extract the spectrum of an extended source (exttype="tophat"):
 $ srctool eventfiles="events.fits" exttype="tophat" srccoord="fk5;20.0,-99.0" \
	   todo="SPEC ARF RMF" PSFtype=none extpars=60
The extpars option depends on the value of the exttype parameter. When using a map to describe a source extent, the PSF corrections must be turned off (PSFtype=none). However, when extracting source products for relatively compact and circularly symmetric extended source, one should turn on PSF modelling, since PSF losses are likely to be important.
2.11 How do I generate an apetool sensitivity map?
The apetool sensitivity maps are based on aperture photometry. Apertures are defined in units of Encircled Energy Fraction (EEF). The first product that needs to be generated is, therefore, a PSF map that provides a measure of the PSF size (in pixels) for different EEFs across the field of view. The creation of the PSF Map requires as input event lists only. Information about the energy interval of interest to generate the correct PSF model is read from the event list header. The flag that controls the generation of PSF Maps is psfmapflag.
$ apetool images="events_image.fits" psfmaps="psf_map.fits" psfmapflag=yes"
or in the case of many input bands:
 $ apetool images="events_image_01.fits events_image_02.fits events_image_03.fits" \
	   psfmaps="psf_map_01.fits psf_map_02.fits psf_map_03.fits" psfmapflag=yes"
The parameter psfmapsampling is currently not used. PSF sizes are estimated in a grid of 21x21 pixels (to be changed in future versions). The final product is a cube that contains PSF sizes in the grid above for the EEF values: EEF = 0.4, 0.45, 0.5, 0.55, 0.6, 0.65, 0.7, 0.75, 0.8, 0.85, 0.9, 0.95.
The next step is to generate a sensitivity map (check the apetool documentation for the algorithm) by setting apesenseflag=yes. The example below assumes that the sensitivity map will use an EEF of 0.65 and a Poisson False Detection Threshold of 4e-6.
 $ apetool images="events_image.fits" expimages="output_expmap.fits" bkgimages="bkg_map.fits" \
	   psfmaps="psf_map.fits" srcimages="source_image.fits" detmasks="detmask.fits" \
	   apesenseimages="sensitivity_map.fits" apesenseflag=yes pthresh=4e-6  eefextract=0.65
The example above assumes that the ermldet source map represents the background against which the sensitivity map is estimated. This means that detected sources are assumed to be part of the background for the determination of the sensitivity map. It is possible to change this by substituting srcimages="source_image.fits" with srcimages="bkg_map.fits".
The parameter bkgimages is currently not used for the construction of a sensitivity map. It is nevertheless expected by apetool and should be provided. The sensitivity maps generated by apetool can be used to, e.g., reconstrunct the number count distribution of X-ray source populations. This is demonstrated in jupyter notebook scripts made available as part of the eSASS4DR1 under <my eSASS path>/eSASS4DR1/eSASS/scripts/apetool.
2.12 How do I use apetool to perform aperture photometry on ermldet sources?
apetool can determine the aperture photometry for sources detected by
ermldet by setting flag apexflag=yes. Given the Maximum Likelihood catalogue produced by ermldet (mllist parameter), apetool will extract the counts, background and exposure time at the sources' positions within apertures with radii defined in units of EEF (eefextract parameter). The Source Map (srcimages parameter) is used to determine the local background of a given source after subtracting from the Source Map the model of the source in question. For apetool to reproduce accurately the ermldet source model and subtract it from the Source Map it needs to use the same cutrad parameter as that used by the ermldet run that produced the Source Map and catalogue. It is up to the user to ensure that this parameter matches the ermldet run input. Using the source map to determine the local background means that the aperture photometry accounts for the contamination of extracted counts from photons associated with the PSF wings of nearby sources (source confusion). The aperture photometry is stored in the filename defined by the parameter apelistout. It is a copy of all the information listed in mllist with additional aperture photometry information. The parameter apelistout can be the same as mllist, in which case the mllist file will be overwritten. The relevant apetool command:
 $ apetool mllist="mllist.fits" apelistout="mllist_ape.fits" images="events_image.fits" \
	   expimages="output_expmap.fits" bkgimages="bkg_map.fits" psfmaps="psf_map.fits" \
	   srcimages="source_image.fits" detmasks="detmask.fits" psfmapflag=no apexflag=yes \
	   emin="200" emax="600" eefextract=0.65 cutrad=15 eindex="1"
The example above determines aperture photometry in a single band, independently if the corresponding ermldet source catalogue contains more bands. ermldet needs to know which rows of the ermldet source catalogue should be updated. The parameter eindex provides this information. In the example above it informs the apetool that the aperture photometry corresponds to the first band in the ermldet catalolgue. It is of course possible to run all the bands simultaneously in which case the eindex parameter is not needed:
 $ apetool mllist="mllist.fits" apelistout="mllist_ape.fits" \
	   images="events_image_01.fits events_image_02.fits events_image_03.fits" \
	   expimages="output_expmap_01.fits output_expmap_02.fits output_expmap_03.fits" \
	   bkgimages="bkg_map_01.fits bkg_map_02.fits bkg_map_03.fits" \
	   psfmaps="psf_map_01.fits psf_map_02.fits psf_map_03.fits" \
	   srcimages="source_image_01.fits source_image_02.fits source_image_03.fits" \
	   detmasks="detmask.fits" psfmapflag=no apexflag=yes emin="200 600 2300" \
	   emax="600 2300 5000" eefextract=0.65 cutrad=15
2.13 How do I use apetool to perform aperture photometry at arbitrary positions?
apetool can also determine aperture photometry at arbitrary positions by setting stackflag=yes. The input file is given by the parameter apelist and should be a fits binary table with columns RA (source's right ascension in degrees; expects double precision number), DEC (source's declication in units of degrees; expects double precision number), RE (extraction radius in EEF units; double precision), RR (source removal radius in units of EEF; double precision). The code will use the RA, DEC positions to extract counts, estimate the background and determine the mean exposure time with an aperture of radius RE. The background estimation is using the source map of ermldet. Before estimating the background at a given input position, any detected sources (read from mllist) within a radius RR from the input position will be removed from the source map. The photometry is stored to apelistout:
 $ apetool mllist="mllist.fits" apelist="mllist_ape_in.fits" apelistout="mllist_ape_out.fits" \
	   images="events_image.fits" expimages="output_expmap.fits" bkgimages="bkg_map.fits" \
	   psfmaps="psf_map.fits" srcimages="source_image.fits" detmasks="detmask.fits" \
	   stackflag=yes emin="200" emax="600" eefextract=0.65 cutrad=15 eindex="1"
2.14 How do I use apetool to estimate upper limits?
Once aperture photometry is available it is straightforward to combine the output of apetool (counts, background, exposure time, eef) to determine upper limits. The basic equations can be found in Ruiz et al. If you find these equations useful please cite Ruiz et al., MNRAS 511, 4265 (2022). The calculation of upper limits using the apetool products is demonstrated in the jupyter notebook script APETOOL_UpperLimit.ipynb made available as part of the eSASS4DR1 under eSASS4DR1/eSASS/scripts/apetool.
2.15 How do I use apetool to perform stacking?
apetool provides the necessary quantities for X-ray stacking: counts, background, exposure time within user defined apertures at arbitrary positions on the sky.
2.16 How can I apply a barycenter correction to eROSITA data?
The eSASS4DR1 package offers a task or option to barycenter eROSITA data. This task is called ebarycen. Read the documentation carefully to learn how to use this task. ebarycen can be also used on EDR data.
3.1 Which FLAGS should be applied to an event list?
The FLAG values can store 32 bits of information. When used as a selection mask in running evtool, the effect is that any event which has at least one of the bits in its flag will be discarded. The minimum recommended setting for the FLAG parameter is 0xE000F000 (hexadecimal system). This will delete all events flagged as either singly corrupt or as part of a corrupt frame, and events that lie outside the nominal field of view. This is the used flag in the 010 data processing of DR1.
$ evtool eventfiles="events.fits" outfile="events_sel.fits" flag=0xE000F000
Note that evtool can only accept a single flag mask at a time, i.e. something like FLAG > 0xE000F00 && FLAG < 0xC0040010 is not allowed. For more documentation on the available flags, click here.
3.2 Which pattern should be applied to an event list?
The released DR1 event files already have pattern=15 applied. The value 15 sets a flag to retain all four of the recognized legal patterns. An expert user might want to vary this, for example, to use instead pattern=1 to select only singles, but leaving pattern at its default it will let pass through everything, bad patterns as well as good ones.
$ evtool eventfiles="events.fits" outfile="events_sel.fits" flag=0xE000F000 pattern=1
3.3 Which good time intervals (GTIs) should I use to produce an exposure map?
The option gtitype in the task expmap specifies the type of good time intervals (GTIs) to be used for exposure map creation. The default value is GTI. If the user wishes to also exclude flared times, obtained e.g. with the task flaregti, then gtitype=FLAREGTI should be used:
$ expmap eventfiles="events.fits" gtitype=FLAREGTI outfile="events_flarefiltered.fits"
3.4 What should be taken into account when producing an exposure map with the task expmap?
Most likely one wants to produce an exposure map that matches an event image. However, the expmap task version available in eSASS4DR1 contains some caveats and can prevent to obtain the right exposure map. Here is a list of things to watch for:
- The task takes from the template image only information about the size and number of pixels in the output exposure map. All information about event selections is taken from the input event list file.
- Make sure, if you have filtered your event list to exclude flag bit 15 (BIT_OUT_OF_FOV), that you call
expmap with --withdetmaps='yes'. The default value for this parameter is 'no'. All the available FLAGS are described here.
- If you have filtered your events using any of the bad pixel related flag bits (8 to 14 inclusive), or used any pattern selection (which happens anyway by default for DR1 products), make sure to call
expmap with --withfilebadpix='yes'. The default value for this parameter is 'no'.
- Make sure to specify in
expmap parameter --gtitype the name of the extension you (last) used to filter your events.
- Make sure the energy bands you choose are the same as those in the matching-order input event lists.
3.5 Does flaregti work on a merged event file?
It is possible to run flaregti on a larger patch of the sky made from merged sky tiles. However, it is required that the xmin/ymin/xmax/ymax parameters cover the range of sky coordinates that the merged event file contains. It is also advised to scale gridsize=18 by the approximate number of sky tiles on each axis.
For extended source analysis, it is also recommended to increase the source_size parameter on flaregti (e.g., to the arcmin scale).
3.6 How can I suppress the output of an eSASS task?
Some eSASS tasks, like expmap and ermldet, produce a lot of terminal output when running. One can just redirect the output to /dev/null, or set the environment variable SASS_VERBOSITY=sparse. This last option should remove most of the output, though unfortunately it also removes any progress information. There is also an quiet option SASS_VERBOSITY=quiet. This should be used carefully, if a given task fails then it will be difficult to trace back the problem unless the options are back to usual values.
3.7 Can the eSASS4DR1 package work on data from the Early Data Release (EDR)?
The data processing version of the eRASS1 data is 010, while the version of EDR is 001. The eSASS4DR1 package corrects data processing issues and improves the different tasks. Therefore, eSASS4DR1 is an upgrade of eSASS4EDR. evtool might have some issues working on 001 data. It is recommended to use the evtool's option:
repair_gtis = yes
3.8 The new evtool version does not accept a region that used to work on the eSASS4EDR version
Indeed, the new evtool version (v2.29.1) in eSASS4DR1 only accepts the radius (or size) of the region in decimal degrees without extra characters. For example, if you want to extract a region with a radius of 30 arcmin, you should write 0.5, not 0.5d or 30'.
3.9 Do eSASS tasks accept compressed FITS files?
Most of the eSASS4DR1 tasks accept compressed (*.gz) FITS files as input. Moreover, they can write their outputs as compressed FITS files as well. However, the tasks radec2xy and flaregti update the input event files, so these two task cannot work on compressed FITS files.
3.10 Images and exposure maps produced by eSASS4DR1 do not seem to match. What is the problem?
As discussed here, the eRASS1 data is organised in sky tiles of 3.6×3.6 square degrees in size. Some of those tiles have data with shared rights, i.e., between the German and the Russian consortiums. The calibrated event lists and the other data products that are released only contain X-ray photons and data that belong to eROSITA-DE. These products can be identified by their file name, which start with "eb01" (see here for the file naming scheme). However, suppose you decide to produce your own data products from these shared-rights calibrated event lists. In that case, you will find that the produced images and exposure maps seem inconsistent, for example:
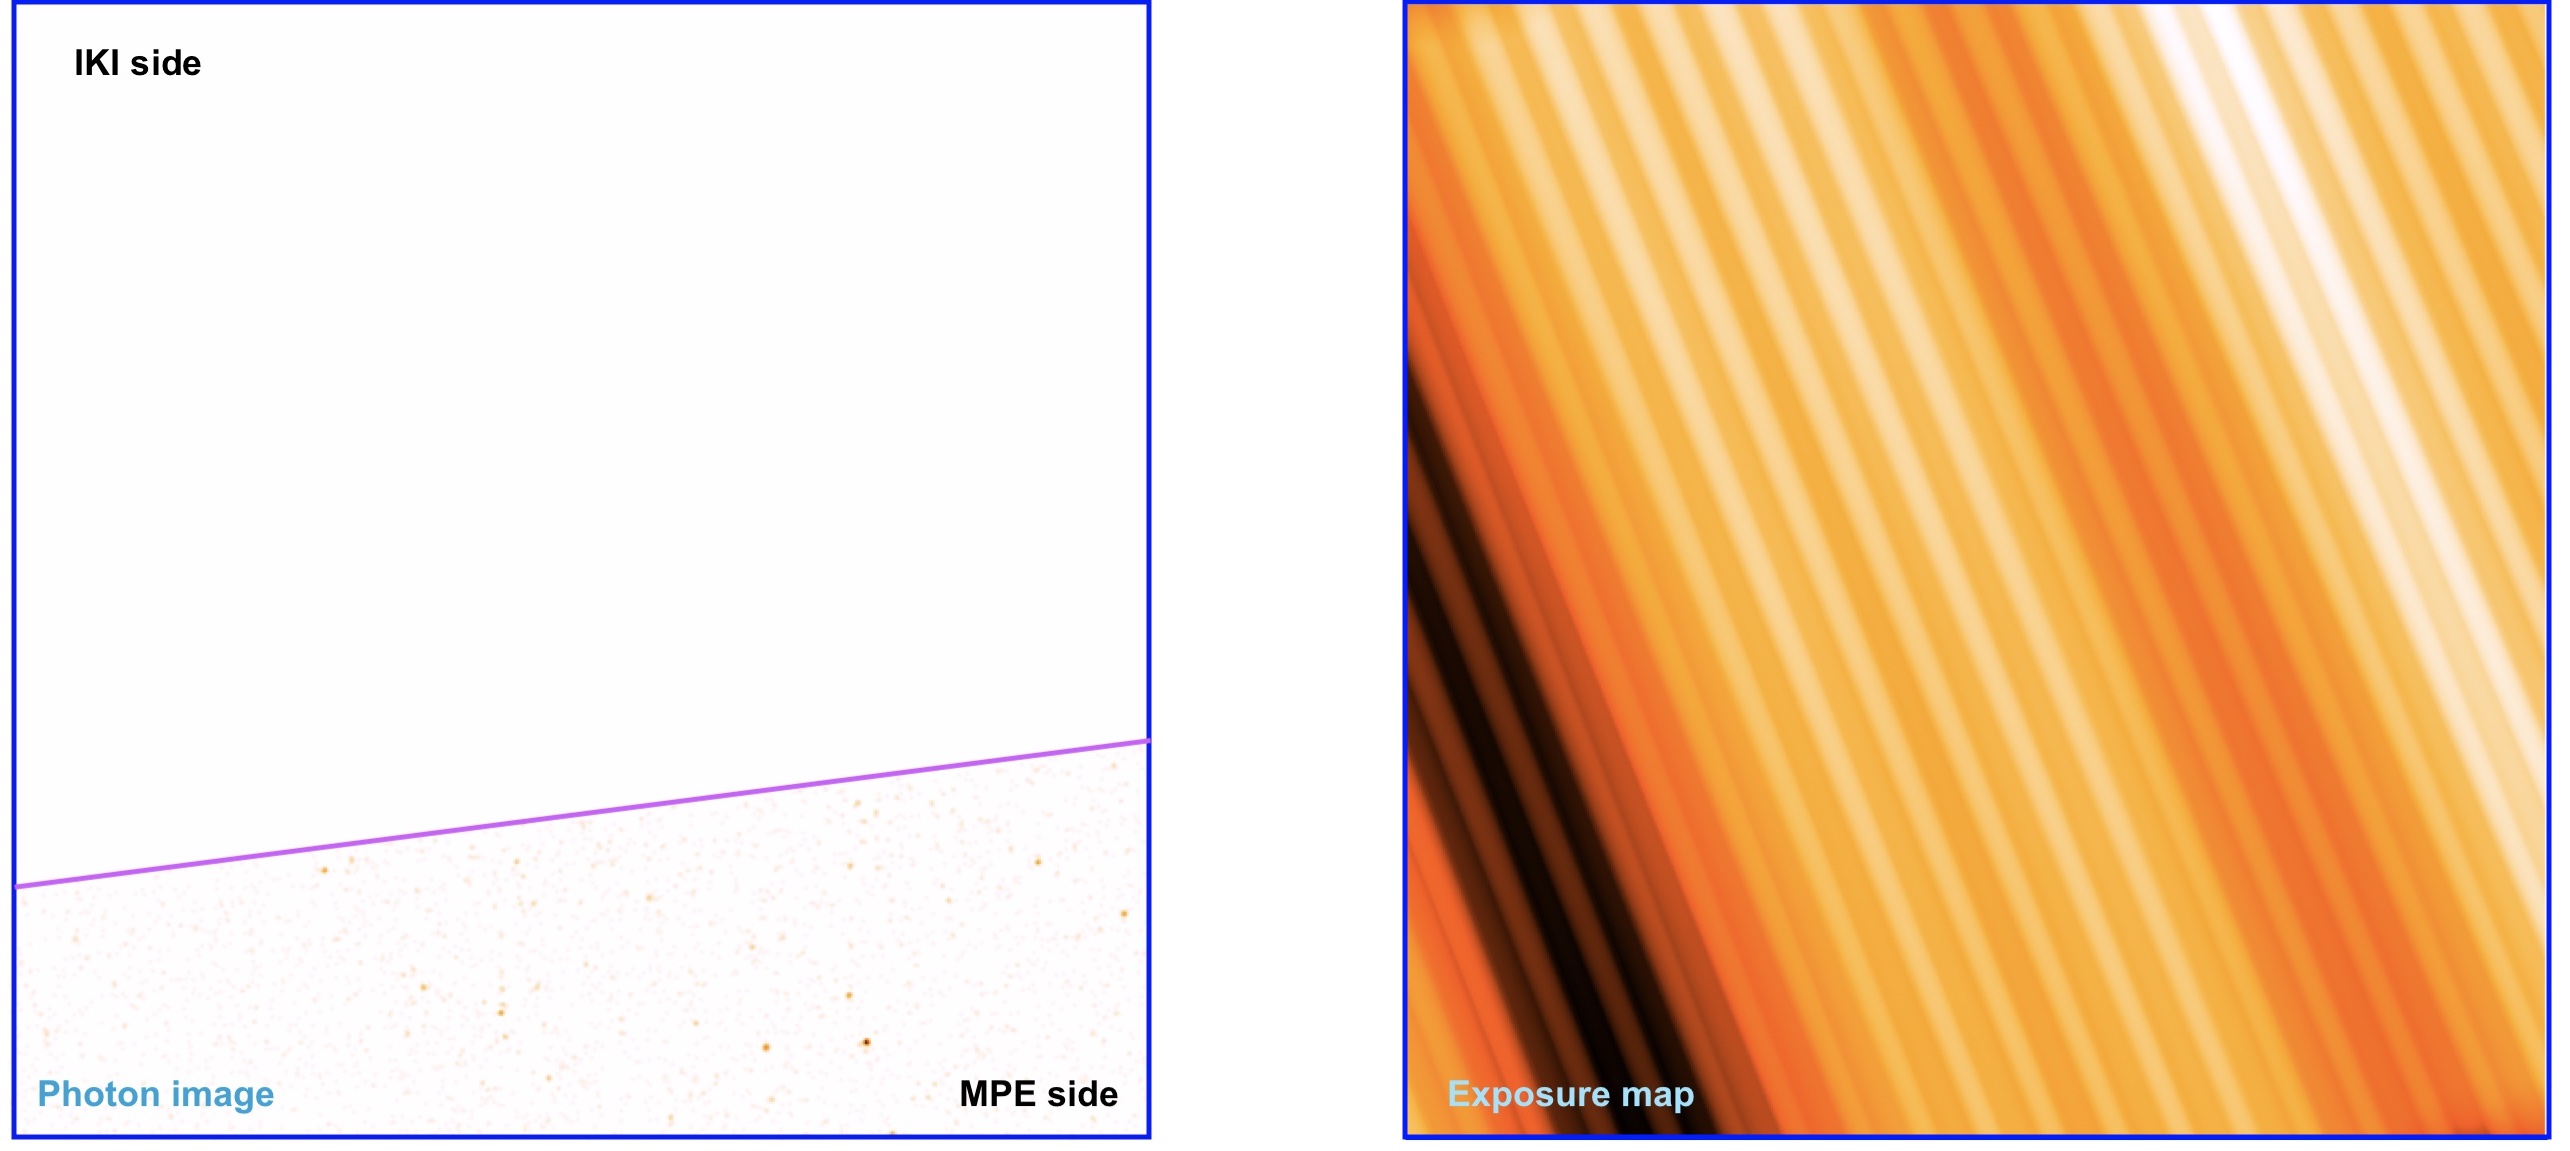
Left: Smoothed photon image of a shared sky tile. Right: Exposure map of the same image produced by the task expmap. Both files have a size of 3.6×3.6 square degrees.
This discrepancy is due to the task expmap, which currently contains no machinery for excluding sky areas based on the ownership event flags.
3.11 Sky tile images produced by eSASS4DR1 seem larger than the ones provided by eRODat. What is the problem?
As discussed here, the eRASS1 data is organized in sky tiles of 3.6×3.6 square degrees in size. However, the sky tiles event lists contain photons beyond the 20 arcmin overlap between sky tiles. If you use evtool to create images out of a single sky tile or multiple sky tiles and use the option size=auto, then the final image will contain all photons that exist in the event list. The following image shows this issue. For example,
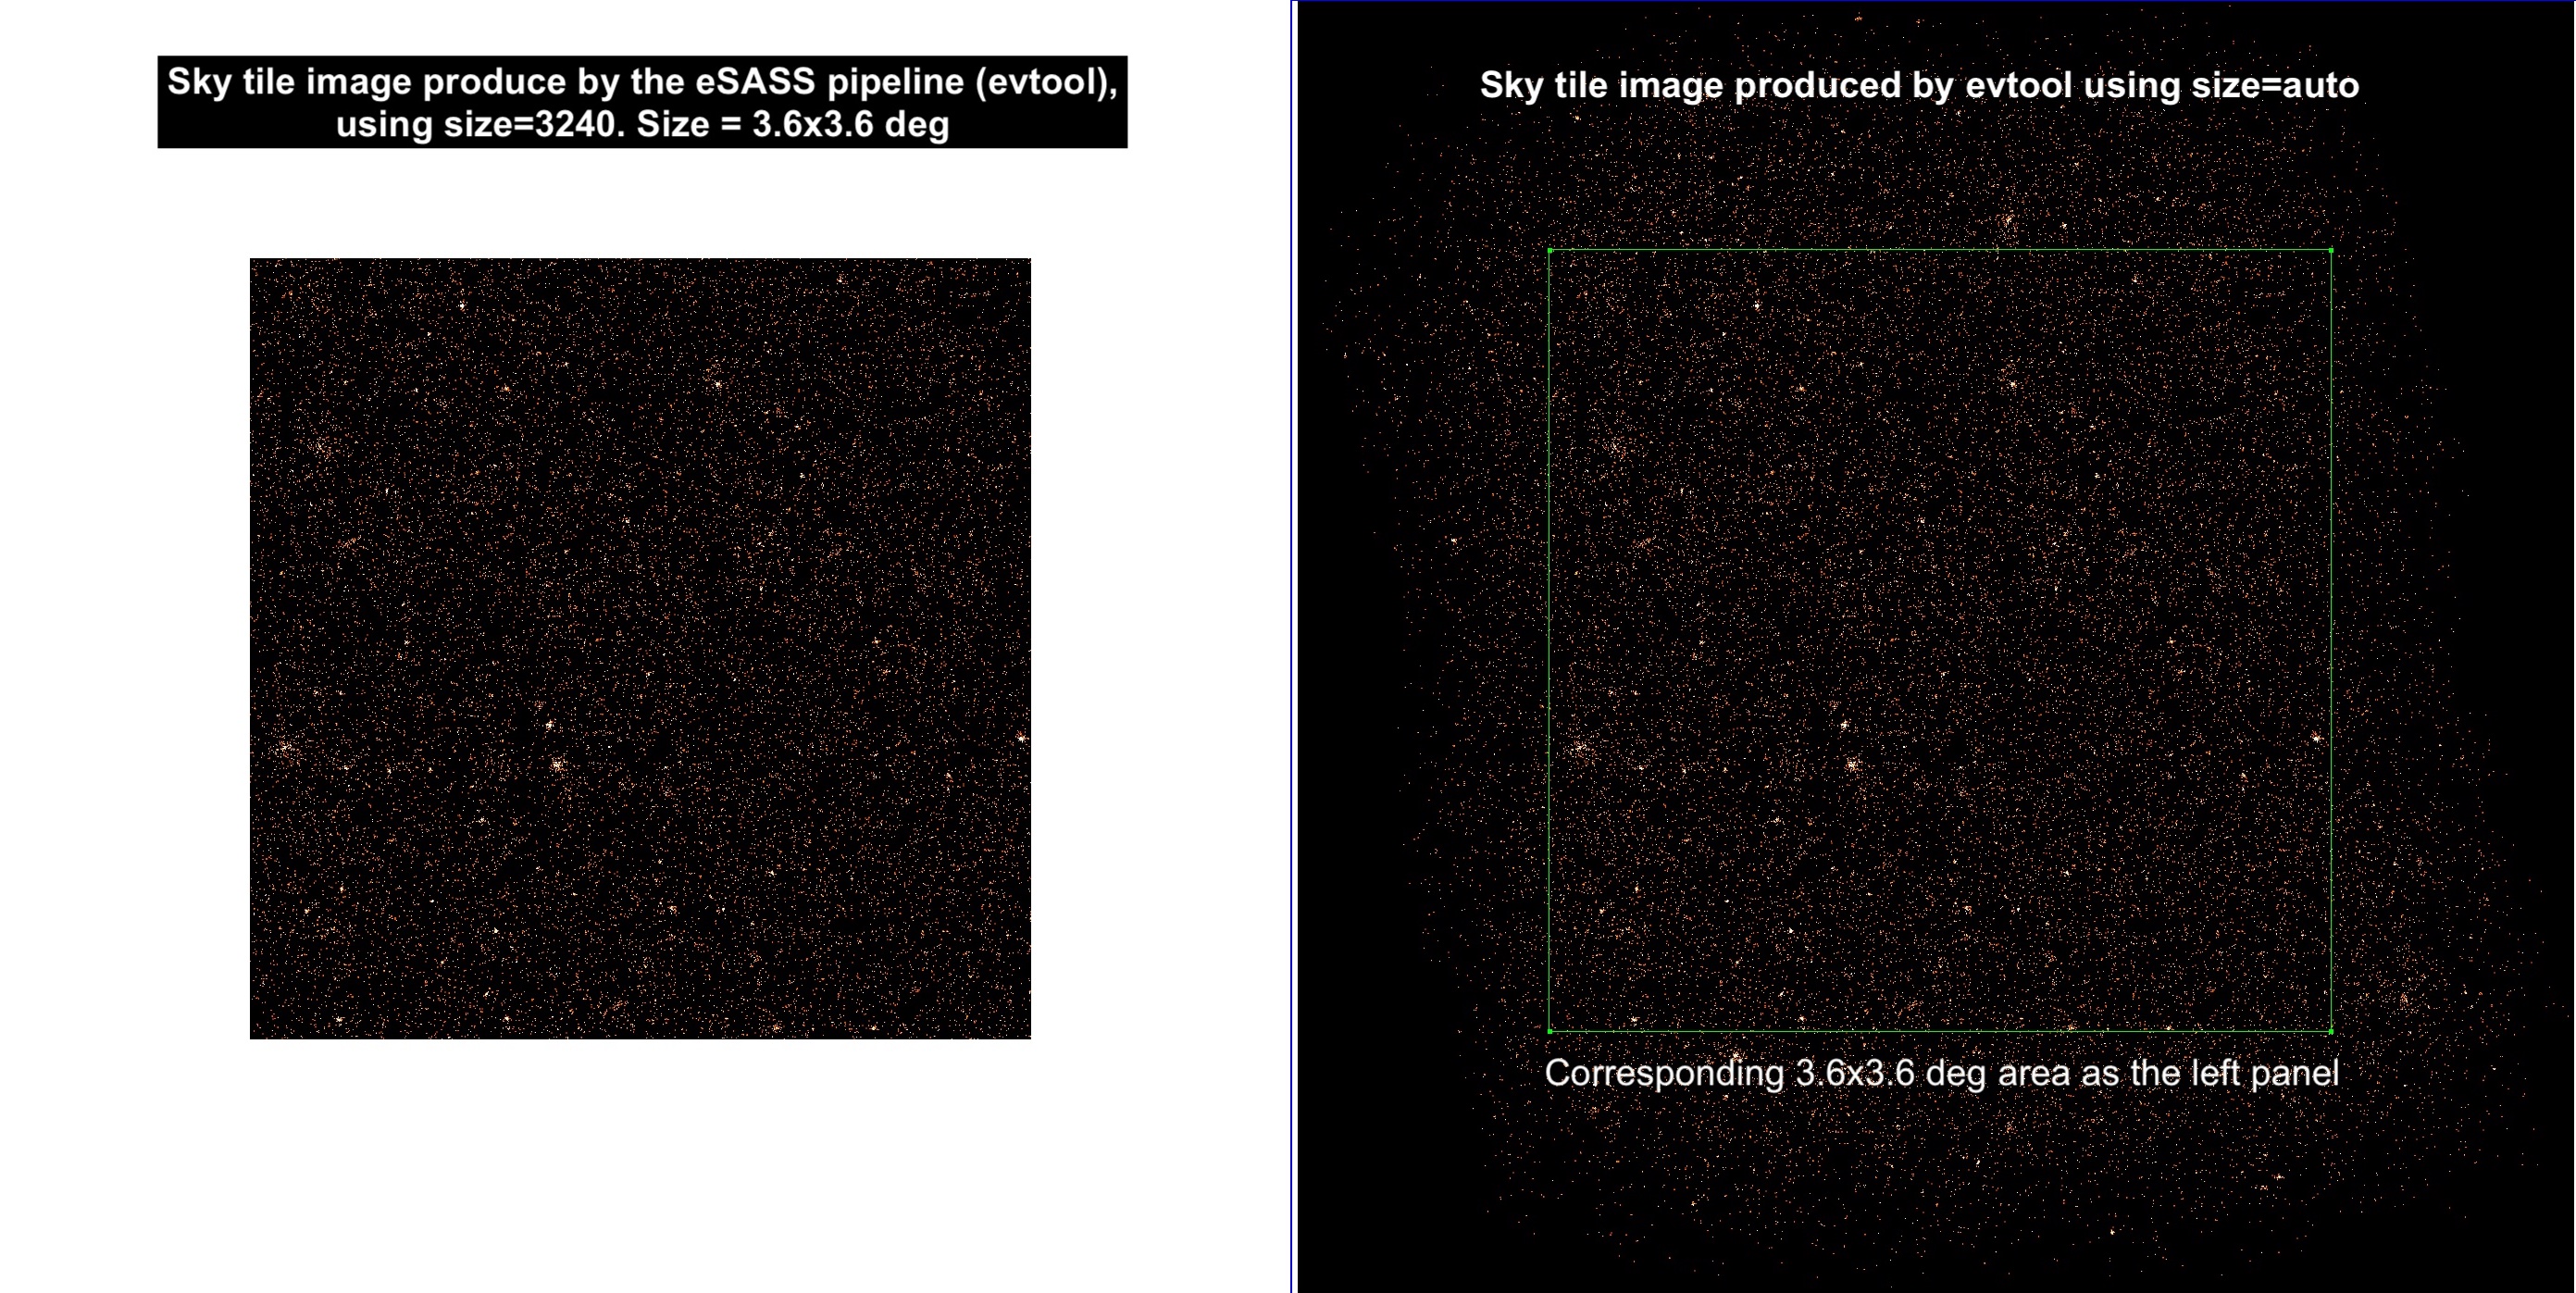
Left: Photon image of a sky tile generated by the eSASS pipeline and available via eRODat. Right: Photon image of a sky tile generated with the evtool task of eSASS4DR1 with the option size=auto. The green box shows the 3.6×3.6 square degrees of the left image.
You have to be careful when cross-checking with other data products provided in eRODat. For example, exposure and background maps have a size of 3.6×3.6 square degrees.