eROSITA in-flight calibration
On this page
1 The eROSITA survey PSF
The PSF of the eROSITA telescopes can be obtained from the survey itself by source stacking to verify the measurements done in the PANTER X-ray test facility and compare to its shapelet representation used in the source detection pipeline. For this 938 sources were taken from the full eROSITA sky, selected from a catalogue of eROSITA point sources with the largest number of counts. To optimise the signal and to avoid bad pixels eRASS:4 was used for TMs 1, 2, 3 and 6, eRASS:3 for TMs 5 and 7, and eRASS:2 for TM4. In this analysis the PSF range was examined out to 4 arcmin radius, to be consistent with the ground based measurements, although there is additional flux beyond this radius, estimated to be about 2.7% from the best fit core PSF (excluding stray light) of Churazov et al. (2023) (their equation A.1). Very brightest piled-up sources and those in crowded fields or near large extended sources were excluded. The position of each source was measured by simultaneously fitting 2D models to two X-ray images, one where the source was inside 15 arcmin of the optical axis, and another when it was outside. Sources were matched against the Gaia G band catalogue to identify sources which are potentially affected by optical loading. The galactic latitude was used to flag those sources potentially affected by scattering halos. Images and profiles of the sources were inspected manually to look for anomalous profiles, such as evidence of extension, or to identify neighbouring contaminating sources. Sources which could be contaminated in the outskirts by other sources or by a non-flat background, were excluded, or the outer radius was manually reduced from 4 arcmin to 1, 2 or 3 arcmin as appropriate. Lightcurves created with srctool were used to quantify pileup, where the inner stacking radius used was chosen as a function of time for a source according to pileup rate thresholds (rates of 15, 44, 100, 155, 250 and 600 s−1 produced inner radii of 20, 30, 40, 60, 90 and 240 arcsec, respectively, based on simulations to estimate the effect of pileup). Source profiles were stacked in each energy band, and for each combination of inner and outer radius. A PSF model plus flat background model was simultaneously fitted to the stacked profiles in all the combinations of radial range, allowing the PSF normalisation and background level to vary in each combination of radial range, to produce a model of the PSF as a function of radius. This process was repeated for each energy band and combinations of TMs.
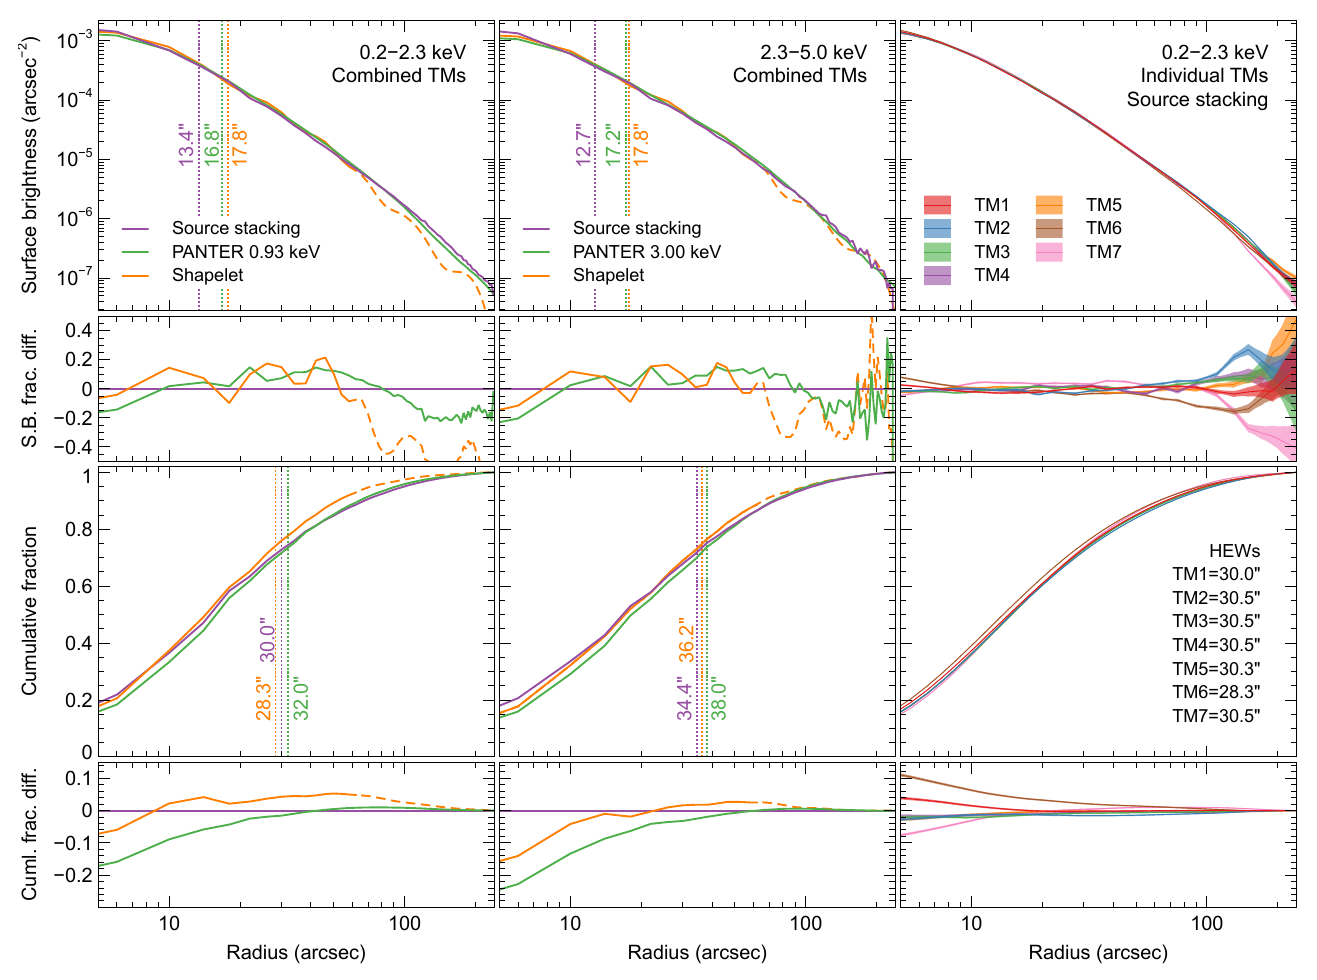
Fig. 1 Comparison of different survey-averaged eROSITA PSFs. Shown are the PSFs in the bands 0.2‐2.3 keV (left panels), 2.3‐5.0 keV (centre panels), or for the individual TMs from stacking in 0.2‐2.3 keV (right panels). The PSF models shown are the survey-averaged shapelet PSFs (Brunner et al. 2022), those obtained by stacking sources and those from ground-based PANTER measurements (Dennerl et al. 2020). The top row of panels show the PSF surface brightness profiles, normalised within 4 arcmin radius, where the vertical lines plot the FWHM values. The second panels down show the fractional difference of the surface brightness of each PSF from the average stacked profile. The third panels down show the cumulative signal as a function of radius, plotting the HEWs as vertical lines. The lowest panels show the fractional difference of the cumulative profiles to the average stacked profile. The shapelet PSFs are those used for fitting the energy band given, the stacked PSF is weighted by the spectra of the input sources, and the PANTER PSF is obtained at the monochromatic energy specified, which is chosen to be representative of the source photons in the band. The shapelet PSF is plotted as a dashed line outside a radius of 1 arcmin, the maximum used for fitting in the source detection pipeline. In the two leftmost columns, the PSF images were rebinned with 4 arcsec pixels where necessary for a fair comparison. In the rightmost column, we show the best fitting model and uncertainties, rather than stacked, rescaled and rebinned count profiles. The FWHMs quoted are sensitive to the pixelisation used and the inner value, and so should be used with care. HEWs were computed from minimally-binned images.
It must be noted here that the survey-averaged shapelet PSF (Fig. 1) is never fitted
to the data by ermldet in photon imaging mode, but rather, a PSF appropriate
for each photon is created. Within 1 arcmin radius the deviations of the PSF are within 20%. Much of the deviation in the shapelet PSF is due to ‘steps’ occurring at
intervals of 16 arcsec radius. At larger radius the shapelet PSF in the soft band is lower than the stacked or ground-based PSF.
This contributes to the shapelet cumulative fraction being higher in the centre, as the profiles are normalised at 4 arcmin
radius. The stacked profiles typically have smaller full-width-half-maximums (FWHMs) than the PANTER and shapelet PSFs, but
comparable HEW. The in-flight eROSITA camera sub-pixel positioning allows a better determination of the PSF core than the
9.6 arcsec pixel would otherwise suggest.
Finally, the uniformity of the PSF across the sky was tested. For this, the sample of 938 point sources described above was devided into four quadrants in ecliptic coordinates (with dividing lines at ecliptic longitude of 180° and ecliptic latitude of 0°) and the HEW of the stacked PSF for TM0 recomputed in the 0.2‐2.3 keV band. The values are consistent with the all-sky average HEW (30.0″) within 0.300″.
1.1 Azimutal symmetry of PSF and positional uncertainties
A key assumption for the astrometric calibration and positional uncertainty determination of the source detection algorithm,
and of the srctool extraction tool is that
the eROSITA PSF can be approximated with a azimutally symmetric function and that the associated positional errors are also symmetric.
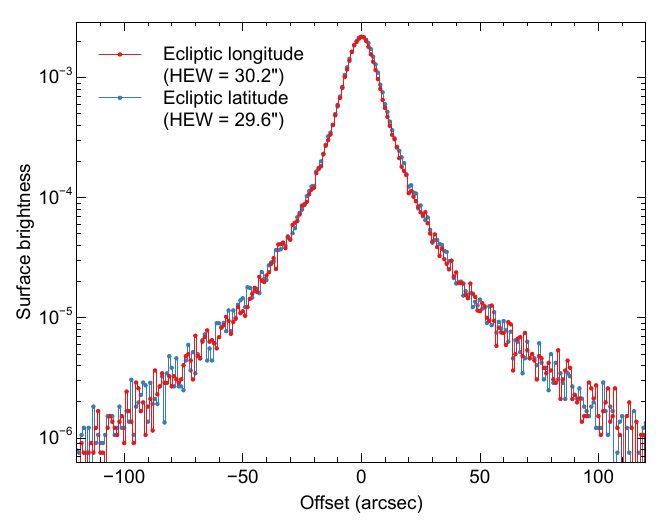
Fig. 2 Profiles of the average stacked PSF along ecliptic longitude and latitude
This assumption can be validated in two ways. Firstly, as it can be seen in Figure 2, the profile of the average stacked PSF
(using the same 938 sources from the all-sky survey as described above) along ecliptic longitude and latitude shows no significant
difference in the two profiles.
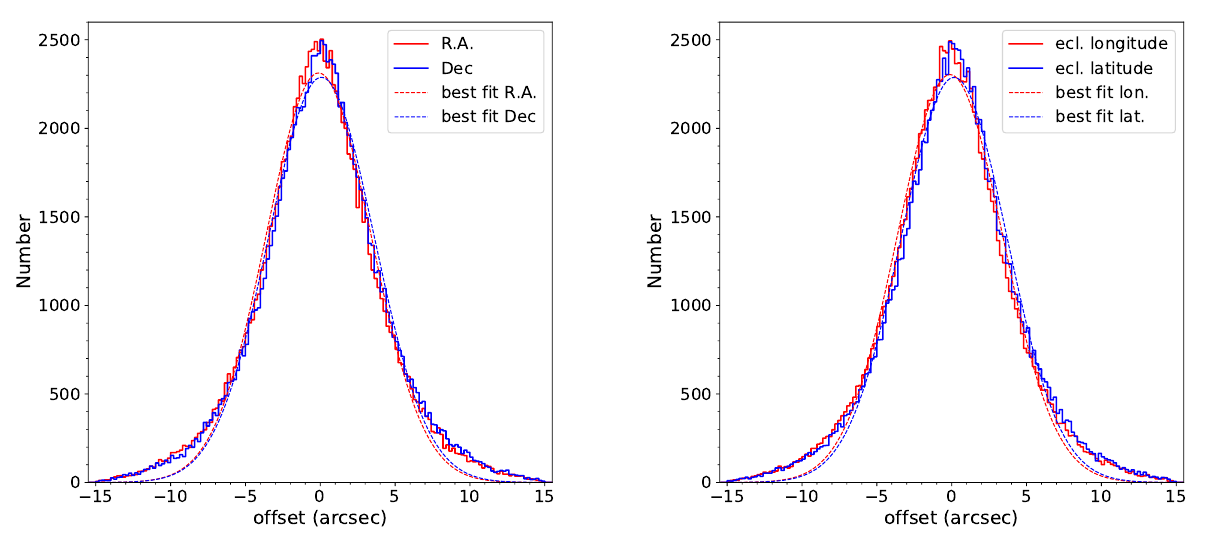
Fig. 3 Distribution of measured positional offset between astrometrically corrected eRASS1 sources with DET_LIKE_0 > 7 and Gaia/unWISE QSOs along equatorial (left) and ecliptic (right) coordinates in arcseconds. The dashed lines represent the best fit gaussian function to these distributions.
Secondly, also the measured positional offset between eRASS1 X-ray source positions and Gaia/unWISE QSOs in both equatorial and ecliptic coordinates directions does not differ significantly. These distributions are fitted with a Gaussian function, from which the following values of mean and Standard Deviation for the offset for the two cases is obtained: (Δα, Δδ)mean = (−0.11″, 0.08″); (Δα, Δδ)SD = (3.5″, 3.5″); (Δλ, Δβ)mean = (−0.11″, 0.16″) and (Δλ, Δβ)SD = (3.5″, 3.5″). From this, it can be concluded that the symmetry approximation is justified, and that the residual offset (of size < 0.2″) is small enough when compared to the positional uncertainty to be safely ignored.
2 Energy calibration
An excellent target for testing the energy calibration is the oxygen–rich SNR 1E 0102-7219 (hereafter 1E0102), the brightest SNR in the SMC. It is characterized by strong emission lines of O, Ne, and Mg, exhibits only little ‘contaminating’ emission from Fe, it is sufficiently compact to utilize the high spectral resolution provided by slitless X–ray gratings (XMM–Newton RGS and Chandra HETG), yet extended enough to minimize any problems with pile–up. This object has been adopted as a standard calibration source by the International Astronomical Consortium for High-Energy Calibration (IACHEC), which has developed a standard (purely empirical) model specifically designed for calibration (Plucinsky et al. 2017).
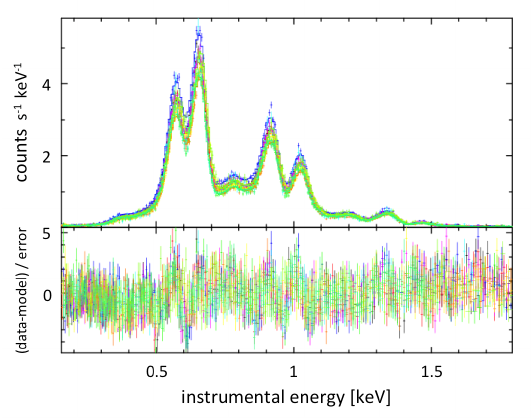
Fig. 4 eROSITA spectra of the SNR 1E 0102-7219, taken with TM12346 in Nov 2019 and 2021.
Figure 4 depicts spectra of 1E0102 taken in dedicated calibration observations on 2019 Nov 7‐8 (60‐61 ks, 16 ks for TM6), and on 2021 Nov 26‐27 (47‐49 ks, 21 ks for TM4), thus covering a time span of more than 2 years. The data were taken with the same onboard processing mode which was used in eRASS. A major difference, however, were the CCD temperatures, which ranged during the first observation between −85.5°C and −84.6°C, and during the last observation between −77.9°C and −77.0°C. Although 1E0102 was observed on–axis, its precise location on the CCDs was different between both observations.
Spectra were extracted with the eSASS tasks evtool and
srctool for each observation and TM12346, separately for a circular
source (1 arcmin diameter) and a background (5 arcmin diameter) region, respectively.
The fits are based on the standard IACHEC model for 1E0102, which consists of 52 narrow Gaussian emission lines, superimposed on an absorbed continuum. The emission lines are organized into 4 groups, corresponding to emission from O VII, O VIII, Ne IX, and Ne X. The normalization of these line complexes were treated as free but TM independent parameters. Only the overall normalization was adjusted individually for each TM. TM specific shifts of the energy scales by XSPEC ‘gain fits’, with all slopes fixed to 1.0 and the 10 individual offsets as additional free parameters were allowed for. This resulted in a common fit of 10 spectra with 24 free parameters. The fit yields a Χ2 = 4055.2 for 2290 degrees of freedom, or a Χ2r = 1.77 (Fig. 4), and the mean energy shift is −1.3 eV for the first and +2.2 eV for the last observation, with a scatter of ±1.0 eV and ±3.0 eV.
These long pointed observations of a line–rich SNR represent a benchmark test of the energy calibration. Considering that the calibration requirements for eRASS spectra are more relaxed due to the much shorter exposure times, the energy calibration is sufficiently accurate for the sources detected in the eROSITA all–sky survey.