Lost photon counts in DR1 data
Energy thresholds are important parameters for X–ray CCDs because they affect their sensitivity, spectral and spatial resolution, and also the telemetry load.
A defining feature of silicon-based detectors is the presence of noise, which increases sharply at low energies, requiring the exclusion of events below a certain energy threshold. If the threshold is set too high, the following issues arise:
- Charge collection completeness is reduced.
- Smaller pixel patterns become more frequent.
- Spectral resolution is degraded.
- Spatial resolution deteriorates.
On the other hand, setting the threshold too low diminishes sensitivity, as noise events near valid patterns can render them invalid. Therefore, it is crucial to set the energy threshold to the lowest value allowed by the noise. A common approach is to apply a constant ADU threshold across the entire CCD. However, this practice has the drawback that slight variations in the noise characteristics of individual pixels lead to different event rates across the array, causing a subset of pixels to dominate the telemetry load.
eROSITA onboard thresholds
In the ground calibration, individual pixel thresholds were determined using long dark exposures, achieving a rate of 1 event/pixel every ∼24.5 minutes. These thresholds were combined into threshold maps. These threshold adjustments align with the event rate to ensure uniform telemetry usage across pixels.
To allow adjustments after launch, a scaling factor for each threshold map was implemented in the onboard computer, taking into account noise levels and telemetry limits. The scaling factor was set between 1.14 and 1.20, but for TM5 and TM7, light leaks required higher thresholds (125 and 145 ADU), preventing the use of predefined maps.
In addition to the trigger threshold, a second threshold controls the downlink of surrounding pixels in the 8-pixel frame. This threshold can be dynamically adjusted between orthogonal and diagonal neighbors. Due to low noise, the dynamic range was maximized for orthogonal pixels, resulting in very low secondary thresholds for them.
eROSITA threshold in the ground processing
Due to variations in pixel thresholds, there is significant scatter in the values, ranging from ∼20 eV to ∼80 eV for TM12346 and ∼60 eV to ∼150 eV for TM57. To achieve a uniform response across the CCD, a third threshold was applied during ground processing. Initially, a constant value of 46 ADU was used for TM12346, but this had no impact on TM57 due to higher onboard secondary thresholds. For other TMs, 46 ADU exceeded the secondary thresholds. This value, chosen based on ground calibration, was later replaced by constant thresholds in eV to improve the spatial homogeneity of the spectroscopic performance.
Thresholds for ground processing were set to 50, 60, 60, 55, 105, 50, and 125 eV for TM1234567. These thresholds were exceeded only by a few pixels onboard. The threshold maps were used on the 010 data processing version comprising the DR1 eROSITA data, but they led to reduced sensitivity and inhomogeneities due to noise, especially in noisier CCD columns.
After noticing the side effects, further investigation revealed that the threshold maps were calculated with eV values which were ~10 eV too low, causing noise issues. The number of noise events exceeding the thresholds became high enough to create false coincidences with valid patterns, especially in noisier CCD columns. This caused a noticeable drop in valid patterns, as shown in Fig. 1, where eROdays 48144-48199 (0.5 Ms exposure) were used to ensure statistical quality. Using fewer eROdays would make the effects barely detectable.
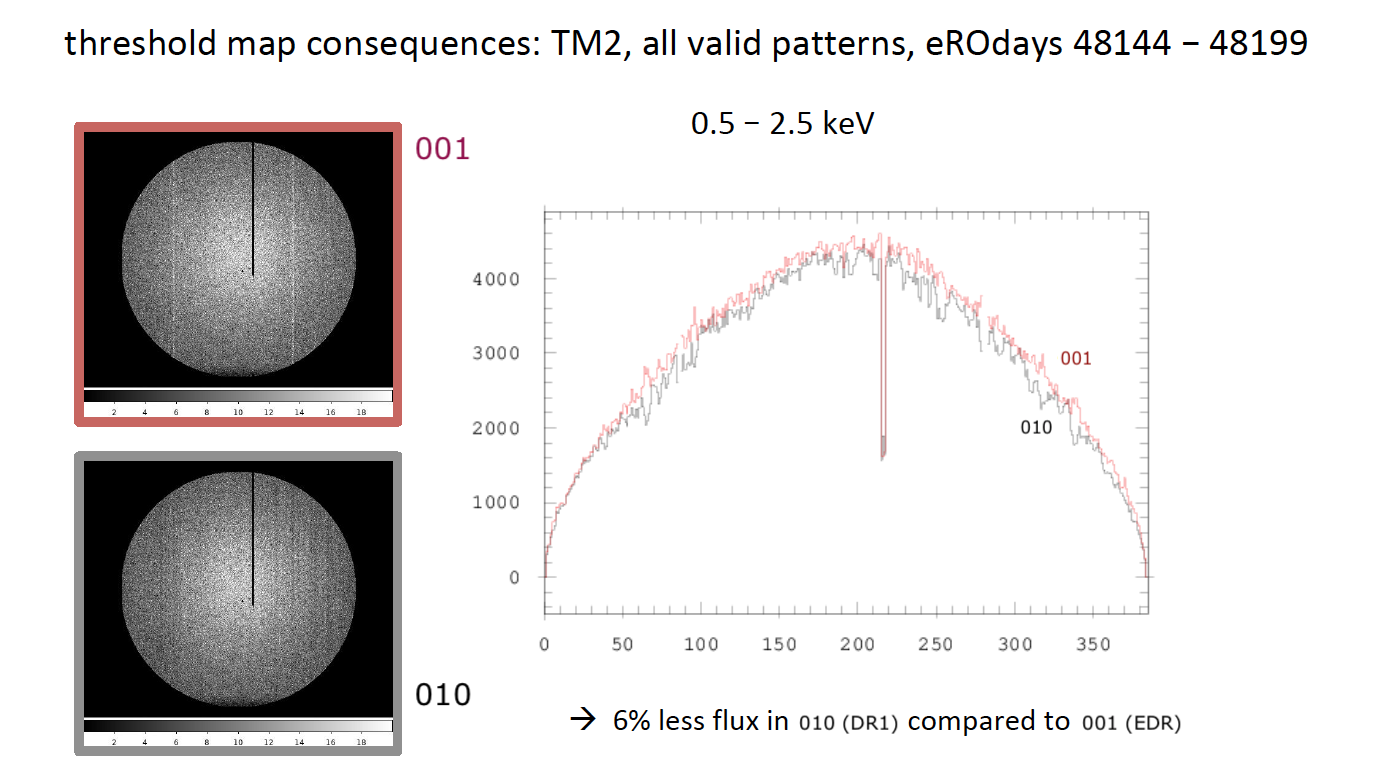
Fig 1. Comparison of the consequence of the change in the threshold from 46 ADU (red) to 60 eV (black) on the spatial distribution and sensitivity. All valid patterns of TM2 detected within the eROdays 48144-48199 in the energy range 0.5–2.5 keV are plotted as images in detector coordinates (left) and in a projection onto the RAWX axis. The overall reduction of the number of valid patterns is 6%.
A deep analysis to understand the above problem was carried out as following. It used the whole time period of eRASS:4, sampled in steps of 100 eROdays (0.63 Ms in total). The study began by lowering the threshold from 46 ADU to 40 ADU for TM12346, as secondary onboard thresholds are all below 40 ADU. As expected, the number of valid patterns decreases with the lower threshold, particularly for singles, which become 'cleaner' and more valuable spectroscopically. In contrast, doubles increase below 1 keV due to particle-induced background. Similarly, triples and quadruples rise as the threshold drops. The overall effect is an improved spectroscopic resolution, but at the price of reduced sensitivity and spatial homogeneity.
Next, the study investigated constant eV thresholds, applying new maps for TM1234567 with thresholds set in 5 eV increments. The impact on sensitivity and spatial homogeneity is shown in Fig. 2 for the thresholds used in the 010 data processing. For TM12346, the 010 version results in fewer valid patterns compared to the 46 ADU version, with drops observed in the 1.0–1.5 keV range. Increasing thresholds reduces these drops and improves spatial homogeneity. For TM5 and TM7, the 010 processing shows no drop in valid patterns and even a slight increase. Overall, trends for singles and doubles remain consistent with those observed for constant ADU thresholds. It turned out that an increase of the thresholds by only 10 eV is sufficient to avoid the problems encountered in the DR1 release, and this setting will be used for future data releases.
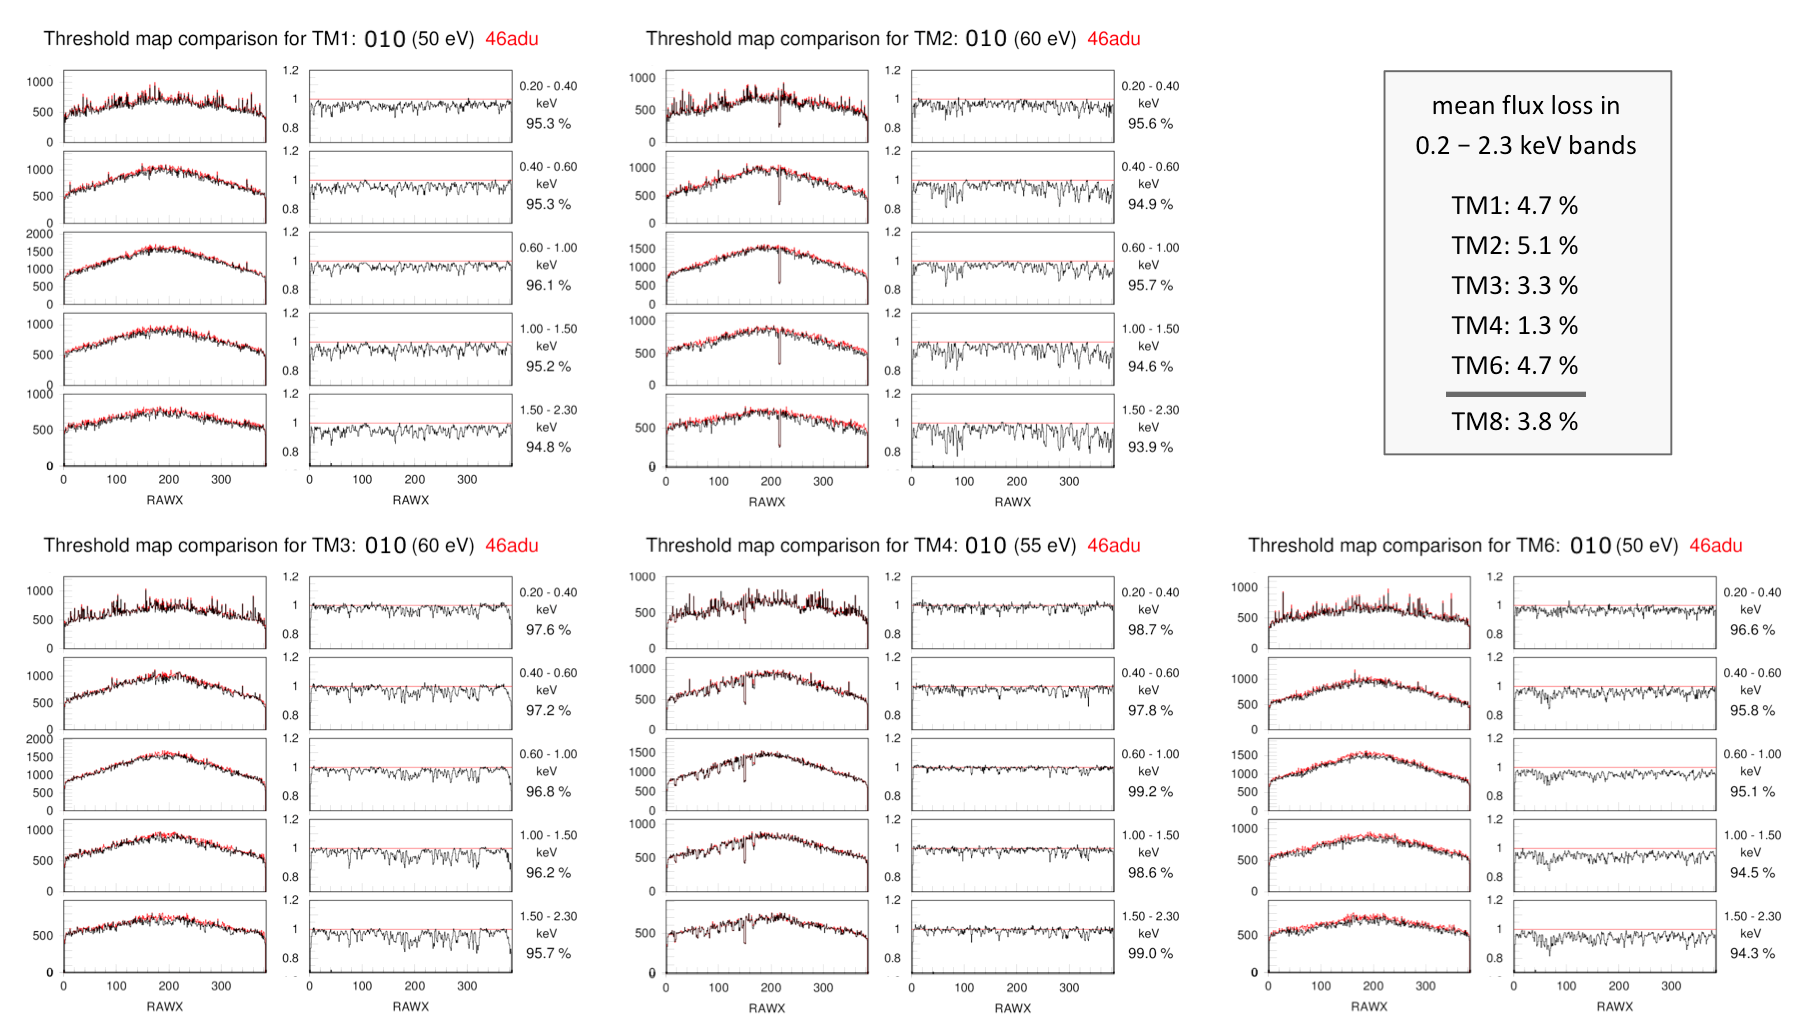
Fig 2. Projection of all valid patterns onto the RAWX axis in the energy bands indicated at right. The red histogram refers to a constant threshold of 46 ADU for reference, while the black histogram refers to the threshold indicated in the header. In the left diagrams, the absolute numbers are plotted, while the right diagrams shows the ratio relative to the 46 ADU thresholds. The average ratio in the number of valid patterns is printed on the right.
On average, due to threshold maps used, there are on average 3.8% fewer counts in the 0.2-2.3 keV band for TM8 in DR1 compared to the EDR and future data releases.