eROSITA light leak of TM 5 and 7
This page provides information on the eROSITA light leak and its dependency on time and orientation of the SRG spacecraft.
On this page
1 eROSITA light leak: telescope modules TM 5 and TM 7
During the commissioning phase of eROSITA, it was noticed that telescope modules (TM) 5 and 7 were contaminated by optical light: a small fraction of sunlight reaches the CCD, by-passing even the filter wheel. The reason why this contamination affects these two cameras is that they do not have an aluminium on-chip optical light filter as the other 5 cameras. This contamination affects the whole CCD; its peak is at the bottom part of the CCD cameras, as illustrated in the following images:
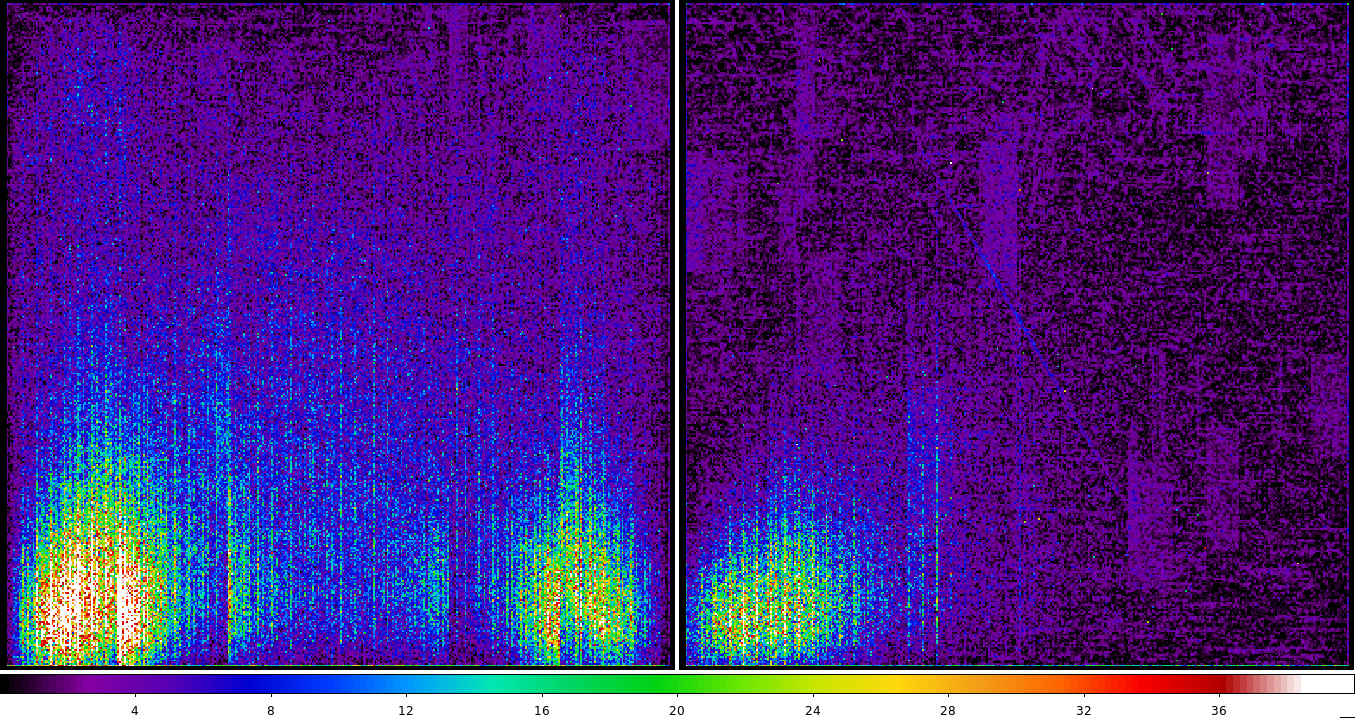
Fig 1. Detector images of TM5 (left) and TM7 (right), which clearly show the optical light leak contamination at the bottom of the CCDs. Both images are scaled to the same level.
The intensity of this optical contamination depends on the orientation of the telescope with respect to the Sun.
The light leak generates a non-negligible amount of telemetry data and decreases the low energy coverage and spectroscopic capabilities for these two cameras. In order to reduce the amount of transmitted data from TM5 and TM7, their primary thresholds are higher (about 125-145 eV) than the ones in the other TMs (about 65-95 eV). The fact that the amount of contamination by optical light is spatially and temporally variable makes it very difficult to derive a calibration for these TMs. For the time being, they should not be regarded as having been calibrated.
2 eROSITA light leak in eRASS1
The first eROSITA all-sky survey (eRASS1) allowed us to understand better the characteristics of the light leak. As described in Section 9.2 of Predehl et al. 2021, these characteristics are:
- The light leak is heavily dependent on the incident angle of the Sun on SRG (see 2.2).
- There are periods of time within one SRG revolution that are almost unaffected by the light leak (see 2.1).
- As shown in Figure 1, the CCD image is not uniformily affected by the light leak on TM5 and TM7
The light leak intensity during eRASS1 is displayed in the following figures:
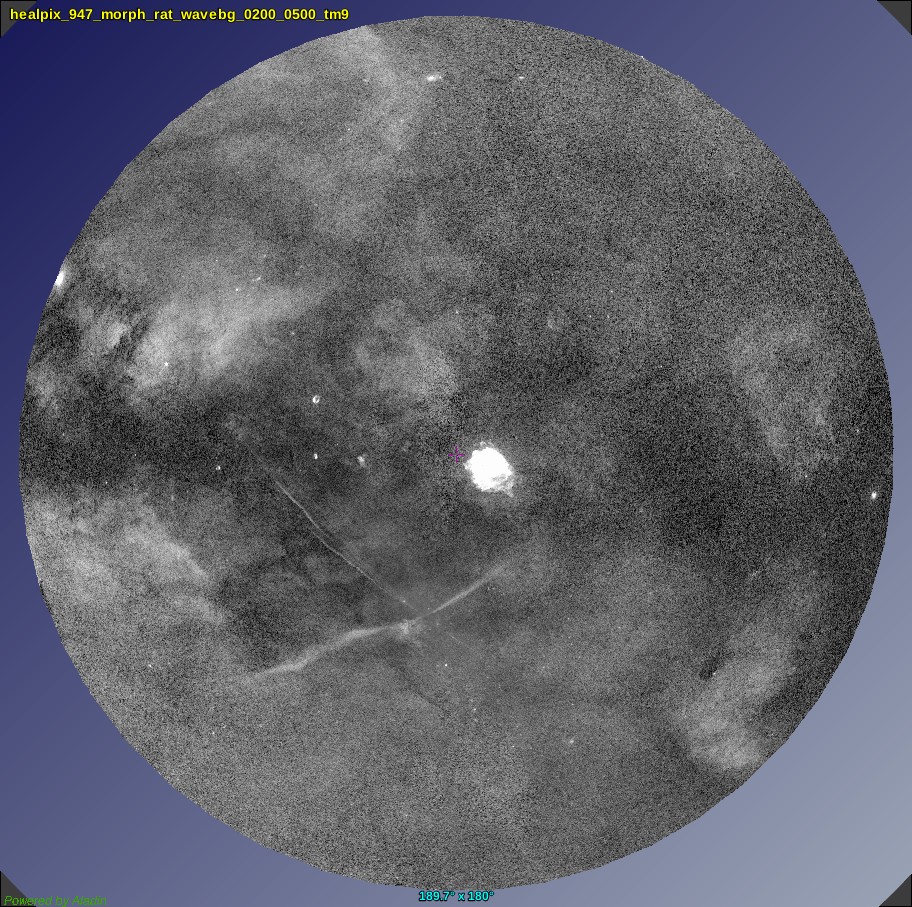
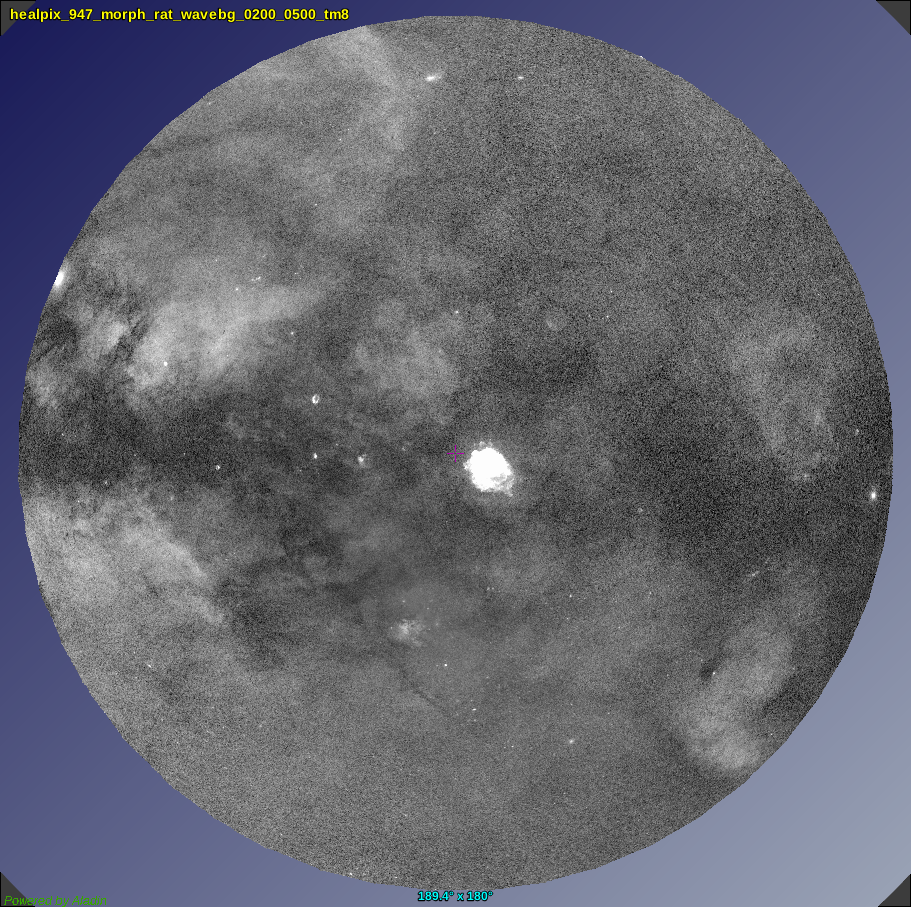
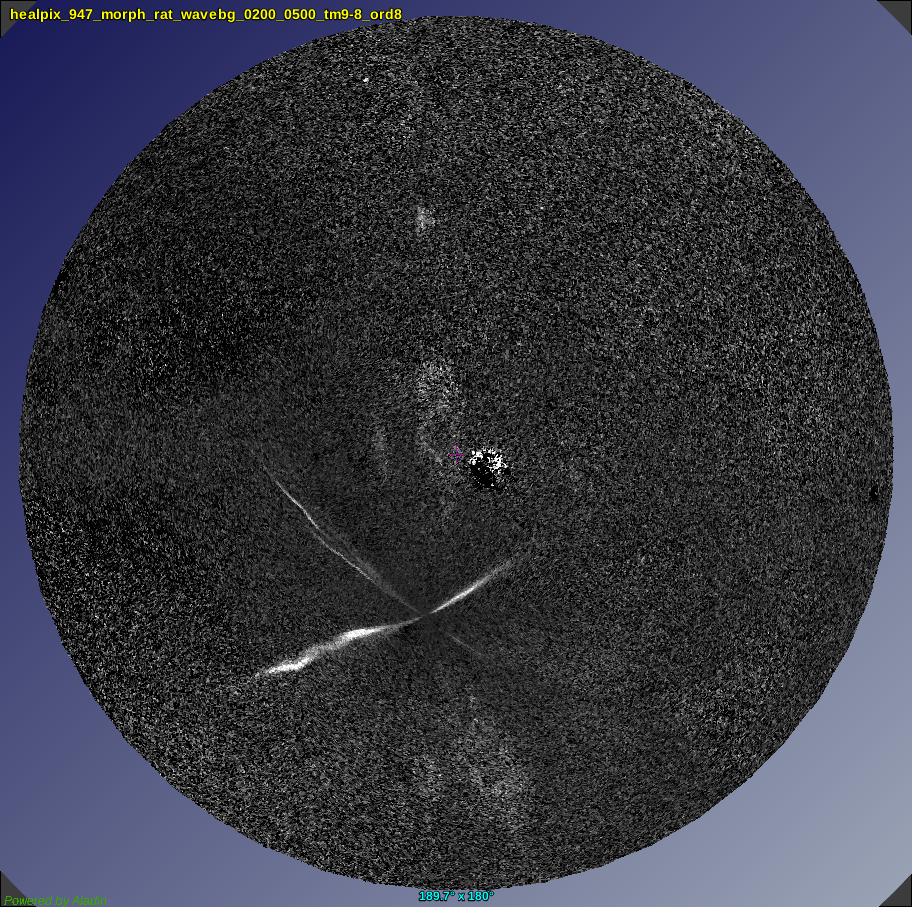
Fig 2. Wavelet-filtered count-rate images of the eROSITA-DE sky for eRASS1 in the 0.2—0.5 keV energy band. The wavelet filtering removes small scale objects (point sources and distant clusters). Left: TM9 cameras (TM5 and 7) which are affected by light leak. Middle: TM8 cameras (TM1, 2, 3, 4, and 6) which are not affected by light leak. Right: subtraction of the TM8 filtered rate image (middle) from TM9 (left). The light leak is visible as well as some extended structures running north-south, which might be also due to the light leak.
The figure above shows the impact of the light leak on the eRASS1 data. The sharp features that appear in the left panel of Fig. 2, are due to the light leak in TM7. These features happened in the following time ranges:
| Start of the light leak [UTC] | End of the light leak [UTC] |
|---|---|
| 2020-02-19 20:59:55 | 2020-02-20 00:59:55 |
| 2020-02-24 08:59:55 | 2020-02-25 00:59:55 |
The light leak occurs at all times. The table above is just a guide to show the times where eRASS1 data is heavily affected by ligh leak. Finally, the light leak appears most prominent below 0.3 keV (see below), but affects all energies. Users are encouraged to take into account the light leak on TM5 and TM7 when analysing eROSITA data.
2.1 Time dependency
As mentioned previously, due to the continuously changing orientation of the spacecraft with respect to the Sun, the intensity of the optical light varies with time. Within one great circle of the survey scan, the light leak variation is already visible:
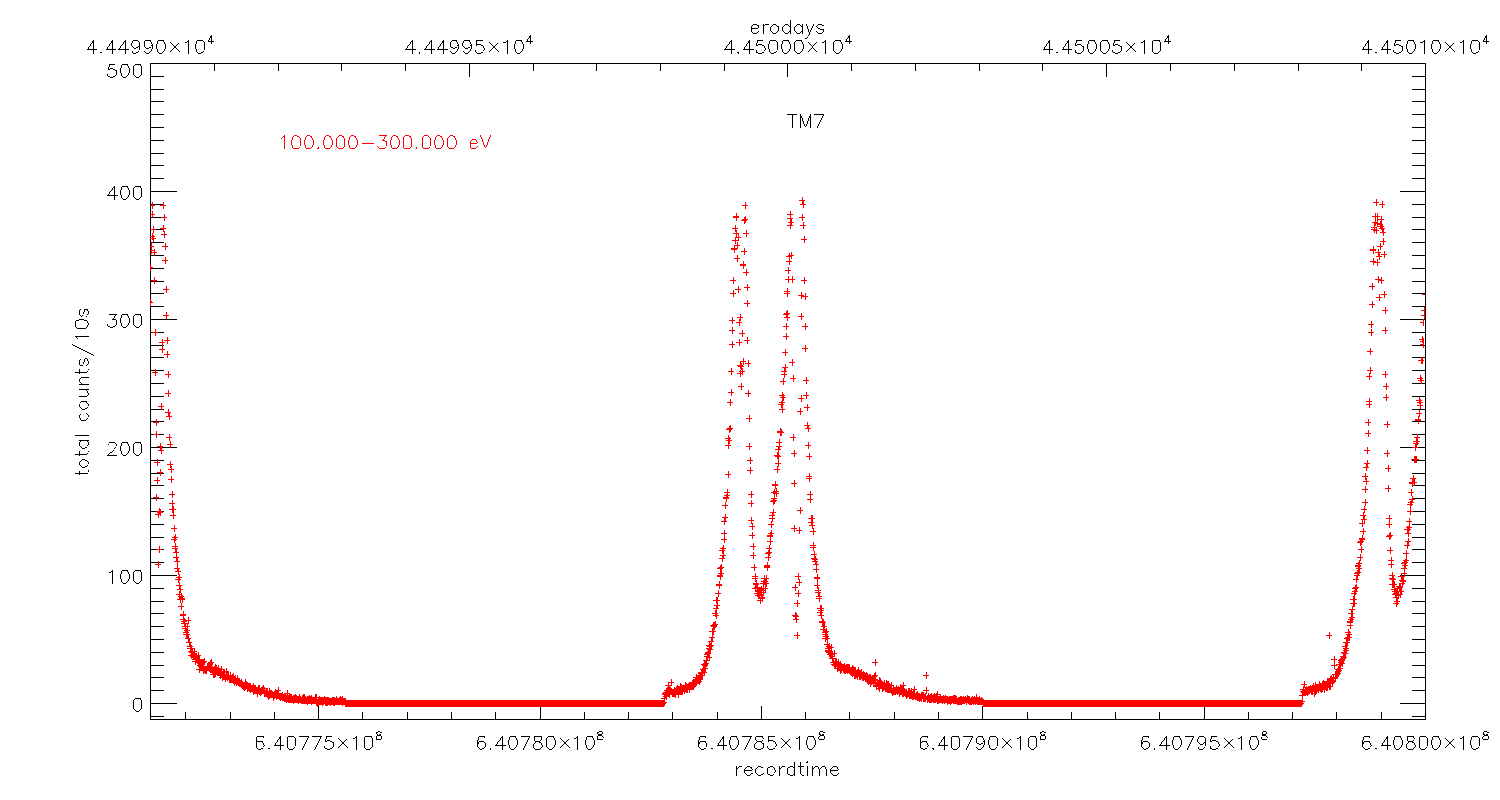
Fig 3. Time resolved light curve (10s) of TM7 of two great circles or two consecutive eRODays.
The scan duration of one great circle is 4 hrs, and it is called an eRODay.
The figures below show the mean countrates per eRODay for TM5 and TM7 below 300 eV (red) and between 300—2300 eV (blue) during eRASS1:
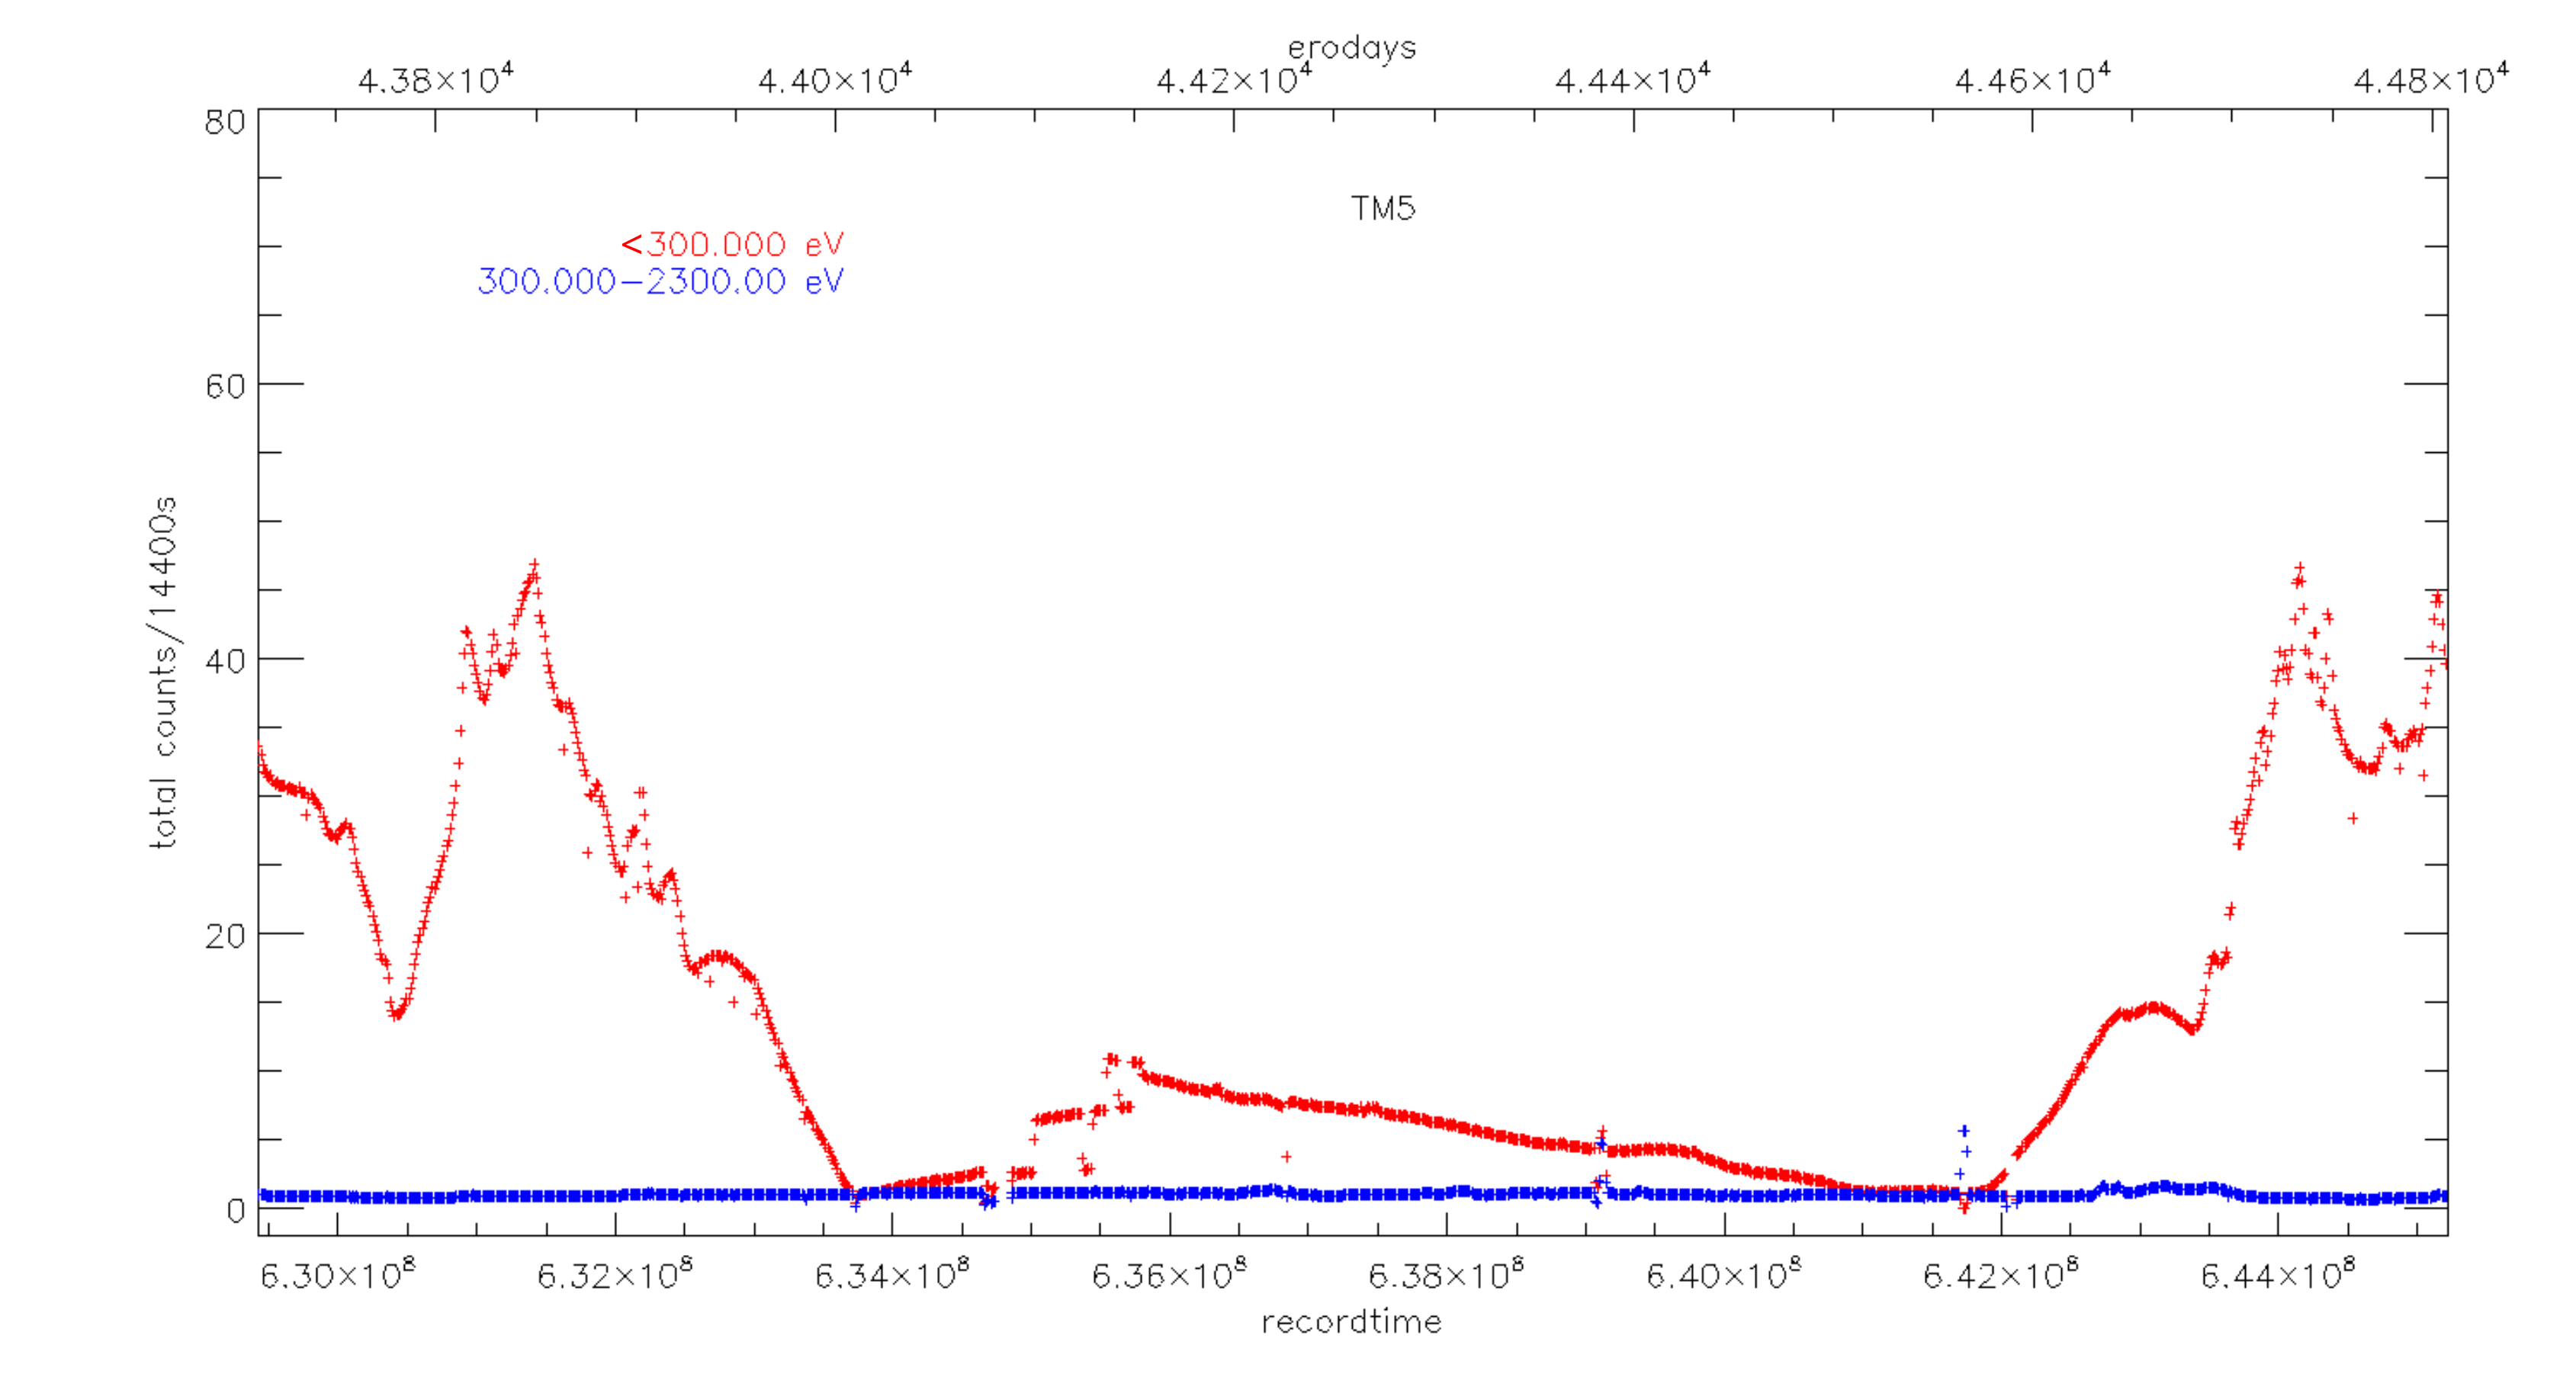
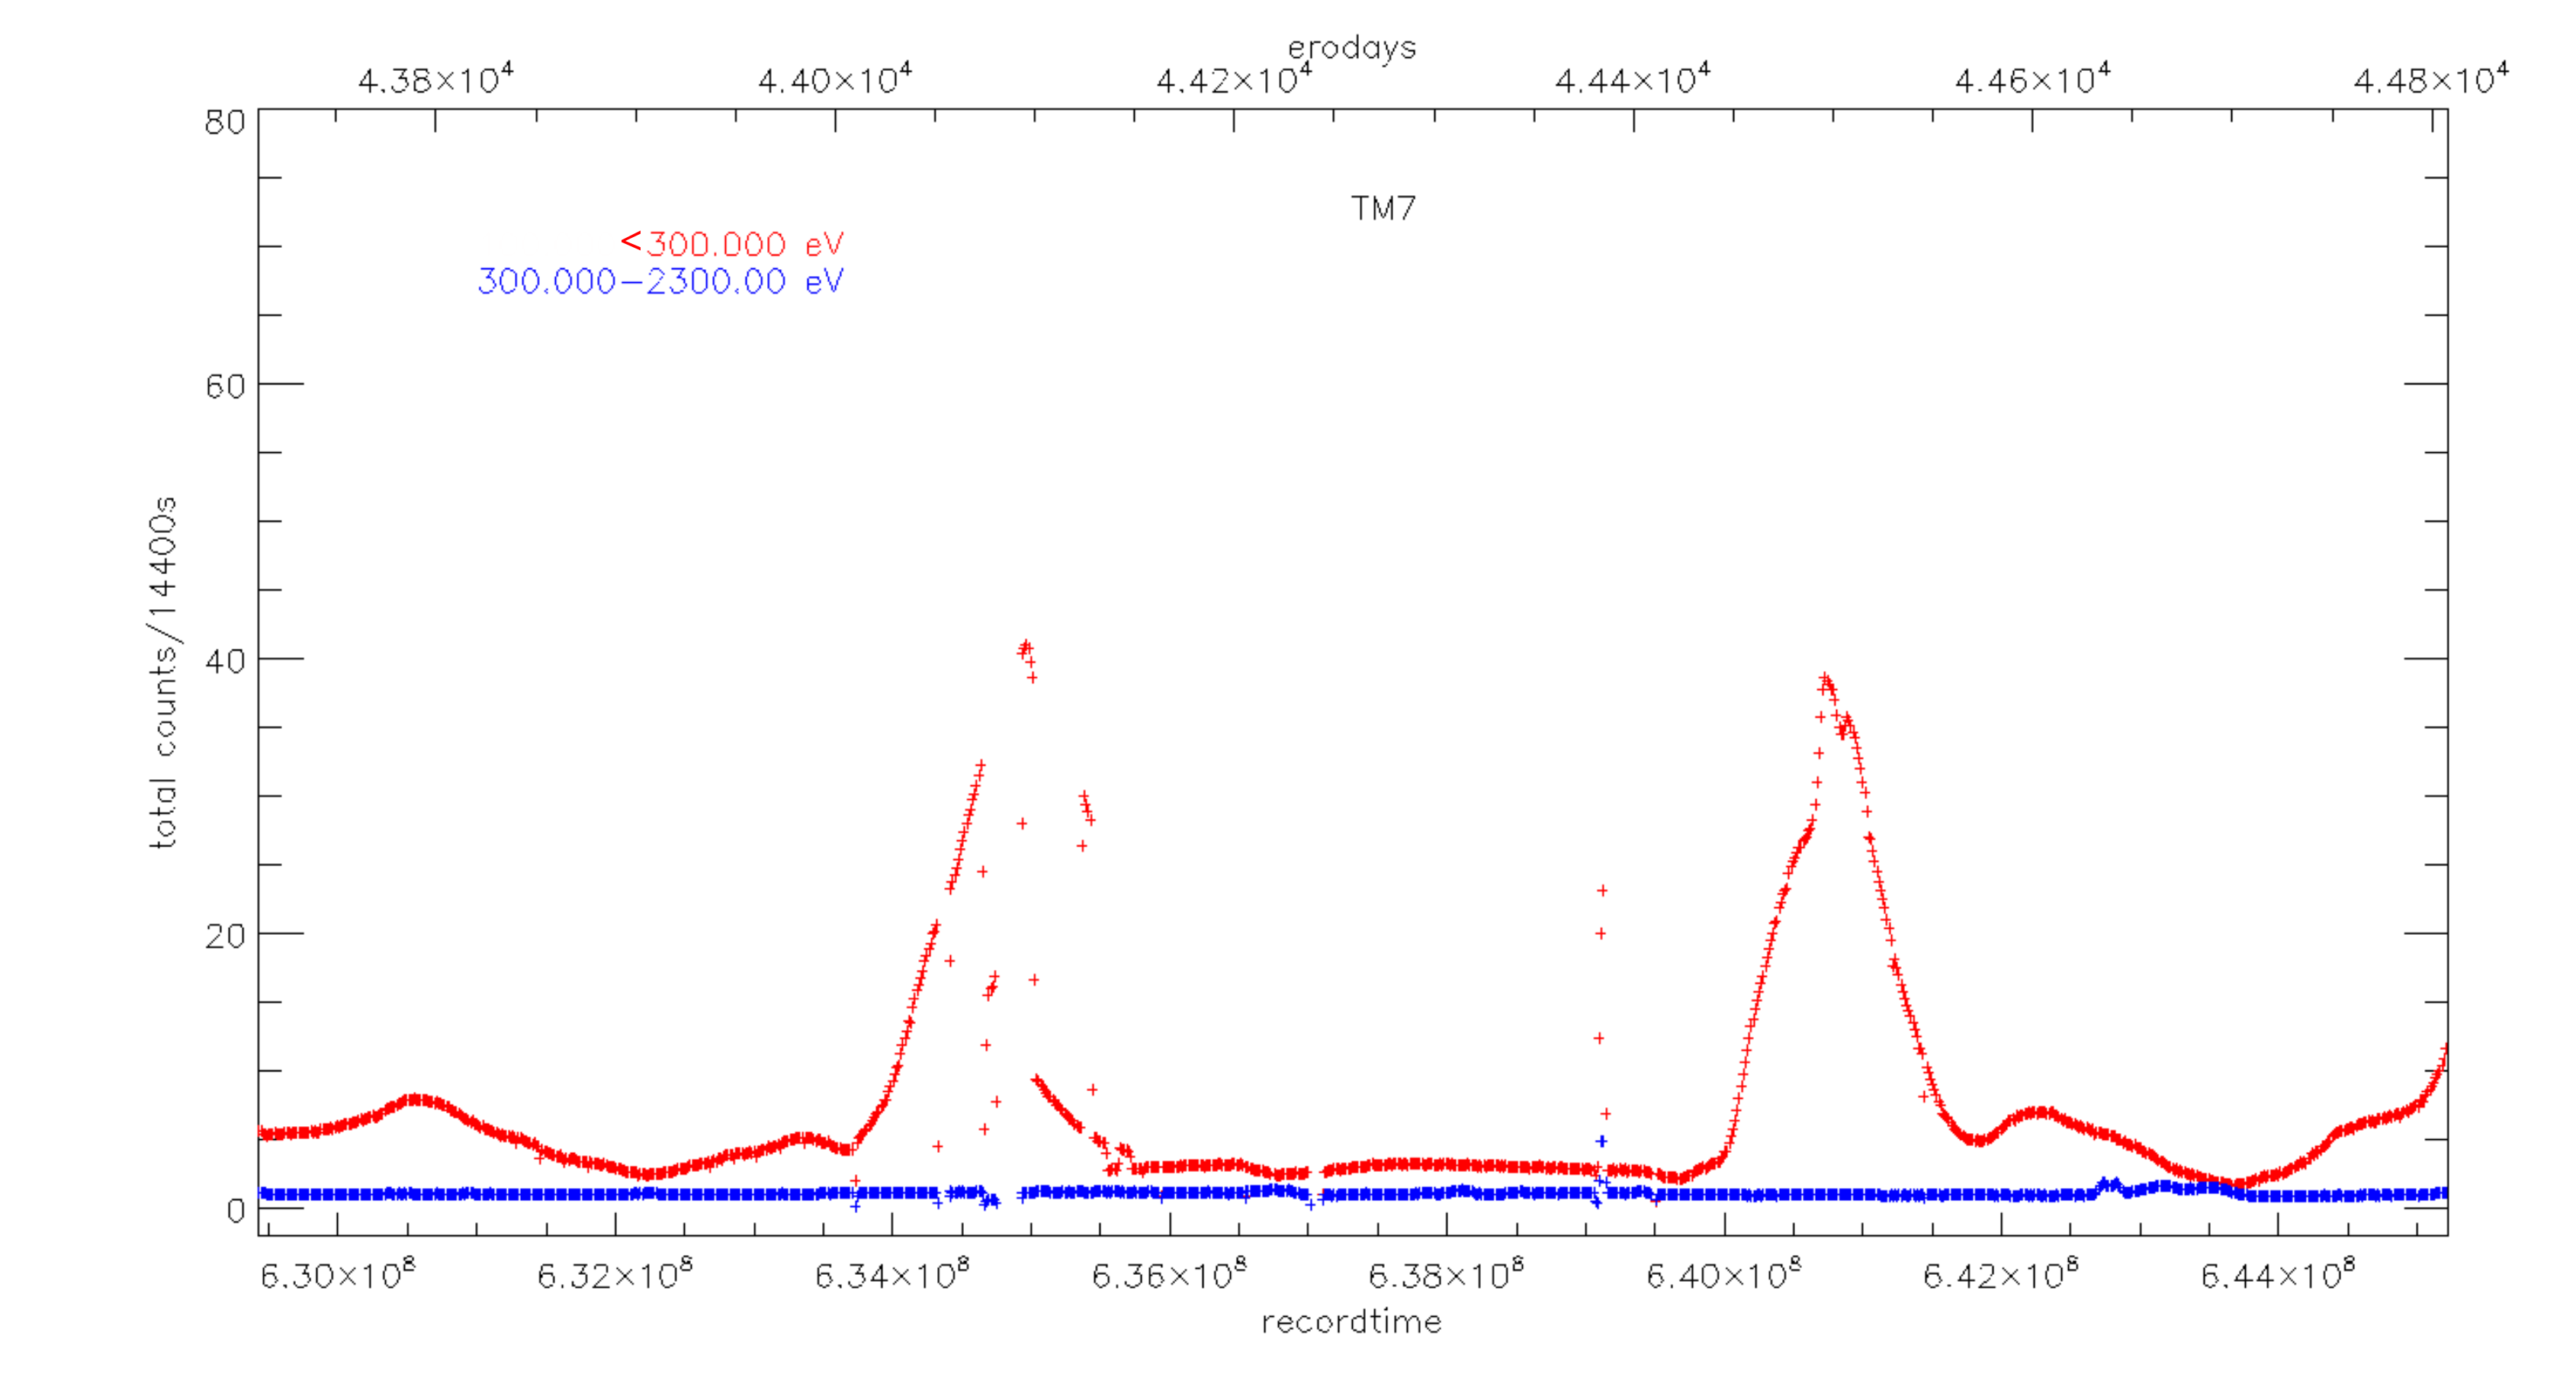
Fig. 4. Light curves of TM5 (left) and TM7 (right) in two different energy bands (red: below 300 eV, blue: 300—2300 eV), which show the optical light leak contamination for low energies.
It is evident that the contamination by the light leak affects the count rates only at energies up to 300 eV (red curve). However the energy scale can be shifted by up to 100 eV . This affects the whole energy range of eROSITA and cannot be calibrated yet.
2.2 Sun angle dependency
The orientation of the SRG spacecraft with respect to the Sun is described by the Sun angles X and XZ (see Predehl et al. 2021 for further details). The figures below show the count rate (in arbitrary units) as a function of the Sun angles X and XZ for TM5 and TM7:
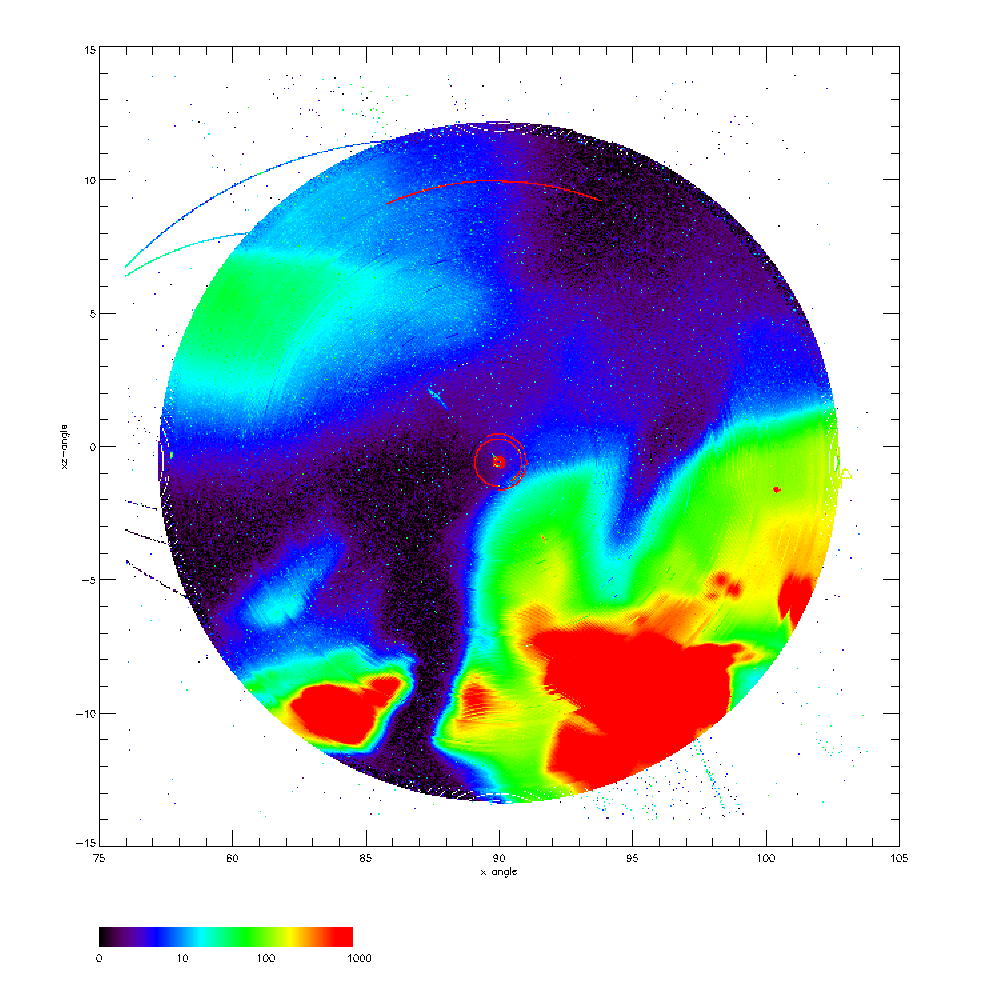
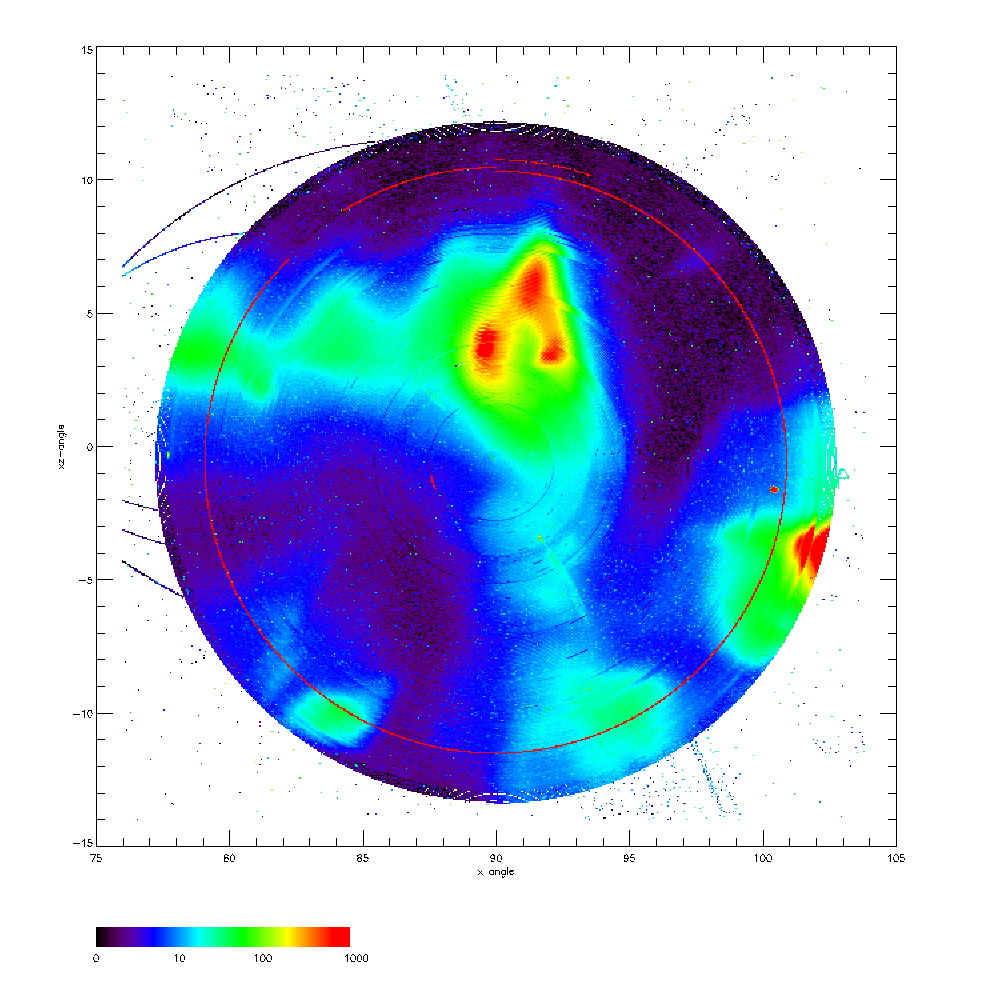
Fig. 5. Dependency of the intensity of the light leak on the orientation of the spacecraft which is defined by the sun angles X and XZ for TM 5 (left) and TM 7 (right). The energy range is restricted to 100—300 eV. The lines to the left outside the circular area are angles that occurred during orbit corrections.
TM5 shows a larger angle range of light leak contamination than TM7.