Coronal Mass Ejections (CME) during eRASS1
Solar activity varies almost periodically according to an 11-year cycle. For example, the numbers of sunspots, rates of solar flares, and coronal mass ejections (CME) are low during solar minimum and significantly increased during solar maximum. SRG/eROSITA was launched on 13 July 2019, very close to the minimum of the solar activity cycle.
Solar flares are eruptions (localised and intense) of electromagnetic radiation, up to gamma-ray energies. The strength is usually classified in terms of soft X-ray brightness. Solar flares are frequently accompanied by the release of high-energetic particles (e.g., protons above 100 MeV, with a significant fraction of the speed of light, arriving at Earth within 10 minutes) and coronal mass ejections. There were no major solar flares (class exceeding B6.4) from July 2019 to July 2020 (the first year in space), except on 29 May 2020 (M1.19 class flare, followed by C9 and C1 flares, the strongest solar event since October 2017) The actual flare happened when eROSITA was scanning the Eastern Galactic hemisphere. Solar flares predominantly affect the highest energy band.
The coronal mass ejections are huge releases of magnetic field lines and associated plasma from the corona into the heliosphere. With a speed of typically 300 — 1500 km/s, they need one to a few days to arrive at Earth. From L1 (location of solar observatories like SOHO) to Earth and L2, it takes only less than a few hours. As SRG/eROSITA is in a halo orbit of ∼700,000 km radius around L2, there may be CMEs missing in-situ detection at SOHO or Earth location, but can still hit SRG/eROSITA (depending on actual position) and cause enhancements of the background (e.g., around 15 Feb 2020).
These CME background enhancements affect all eROSITA energy bands.
In eROSITA All-Sky Survey data, they appear as degree-wide (size of FOV) bright stripes if projected onto the sky.
They can be filtered using the eSASS task flaregti.
Such time filtering has already been applied to the DR1 data.
However, a few residual enhancements may be present in the data. Five such “stripes” can be identified in the count-rate images of the eROSITA-DE sky for eRASS1
in the standard energy bands 0.2—0.6 keV, 0.6—2.3 keV, and 2.3—5 (s. Fig. 1 and enlargement). Number 1, 1a, and possibly 2 refer to CMEs listed in the
table below, numbers 2a and 3 could not be assigned to any CME. Depending on the individual scientific need, a somewhat stricter screening might be needed.
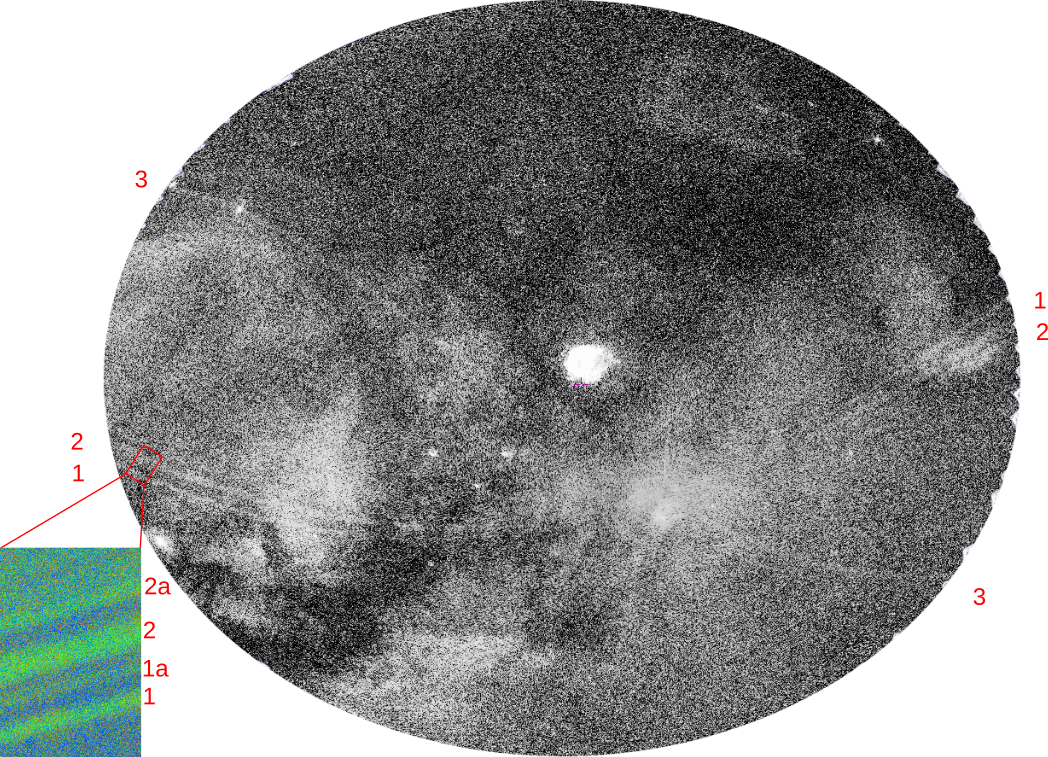
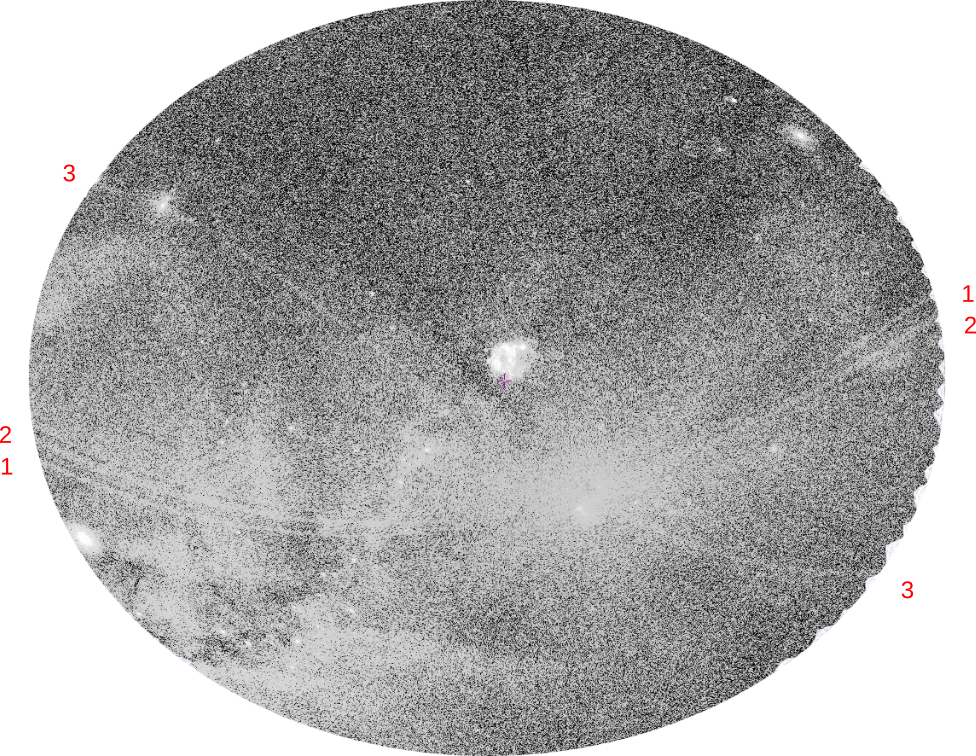
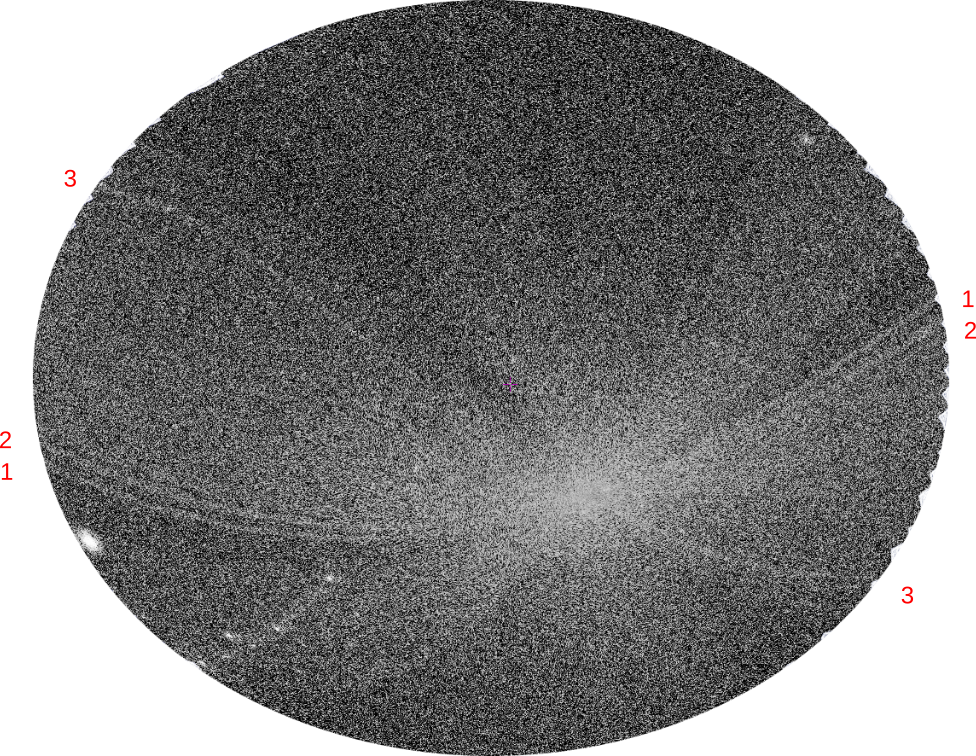
Fig 1. Count-rate images of the eROSITA-DE sky for eRASS1 in the 0.2—0.6 keV energy band (left), the 0.6—2.3 keV energy band (middle), and the 2.3—5 keV energy band (right). Five residual enhancements (“stripes”) can be identified, two are very dim and can only be seen in the enlargement (numbered 1a and 2a). Number 1, 1a, and possibly 2 refer to CMEs listed in the table below, numbers 2a and 3 could not be assigned to any CME.
The following table lists all Earth-facing CMEs from SRG/eROSITA launch until the end of eRASS1 (mid-June 2020). It gives the release time at the Sun, the time of detection at Earth, the converted spacecraft clock time and the corresponding eROday (in units of 4h), SRG/eROSITA position in geocentric solar ecliptic coordinates (in units of Earth radii), the eROSITA light curve in 4 energy bands (0.5—1.0, 1.0—2.0, 2.0—4.0, 4.0—9.0 keV, respectively), along with some comments.
However, a few events (around mid-February 2020) are visible in lightcurves and sky maps that have yet to have an immediate counterpart in the list of Earth-detected CMEs. These have been added manually from other sources (see at end of page).
| CME release date @ Sun | arrival date @ Earth | S/C clock | eROday | SRG_YZ | SRG_Y | SRG_Z | lambda | eROSITA lightcurve | Comment |
|---|---|---|---|---|---|---|---|---|---|
| 2020-05-26T00:39:00-CME-001 | 2020-05-29T22:00 | 644115605 | 44731.25 | 105.25 | -103.88 | 16.96 | 167.8 | E_6_44731.gif | weak |
| 2020-03-02T20:00:00-CME-001 | 2020-03-06T14:00 | 636829205 | 44225.25 | 116.65 | 116.61 | -3.21 | 65.9 | E_6_44225.gif E_6_44291.gif | weak CME, followed by some other enhancement |
| 2020-02-28T17:00:00-CME-001 | 2020-03-04T18:00 | 636670805 | 44214.25 | 112.97 | 112.97 | 0.56 | 64.4 | E_6_44214.gif | weak CME |
| HCME_A__20200215_01 | 2020-02-19 | ~44130 | 74.80 | 69.08 | 28.69 | 51.9 | E_4_44130.gif E_4_44140.gif E_4_44150.gif | weak CME?, jump in solar wind density at eROday 44136, #1 and #1a | |
| HCME_A__20200212_01 | 2020-02-17 | ~44117 | 68.87 | 60.60 | 32.73 | 49.9 | E_4_44117.gif E_4_44124.gif | weak CME?, possibly #2 | |
| 2019-10-25T05:54:00-CME-001 | 2019-10-29T15:02 | 625687325 | 43451.51 | 60.57 | 39.07 | -46.28 | n.a. | E_6_43451.gif | lot of variability before, then bright pointed observations, geomagnetic storm detected on 26-Oct, solar wind speed increase after 24-Oct |
| 2019-09-17T03:05:00-CME-001 | 2019-09-21T03:39 | 622363145 | 43220.66 | 139.50 | 137.77 | -21.93 | n.a. | E_6_43220.gif | not detectable due to field scan and thus intrinsically variable background |
The (geocentric solar ecliptic, GSE) distances of SRG are in units of Earth radii (R_E = 6371 km), with YZ = SQRT(Y**2+Z**2). The ecliptic longitude (lambda) is given (modulo 180) in degrees during survey mode, to give a hint on locations of possible stripes.
In addition to these selected light curves above (based on CME arrivals) there are also eROSITA light curves available for 100 eROdays each:
- 437xx: 2019-12-10 - 2019-12-26
- 438xx: 2019-12-26 - 2020-01-12
- 439xx: 2020-01-12 - 2020-01-29
- 440xx: 2020-01-29 - 2020-02-14
- 441xx: 2020-02-14 - 2020-03-02
- 442xx: 2020-03-02 - 2020-03-19
- 443xx: 2020-03-19 - 2020-04-04
- 444xx: 2020-04-04 - 2020-04-21
- 445xx: 2020-04-21 - 2020-05-08
- 446xx: 2020-05-08 - 2020-05-24
- 447xx: 2020-05-24 - 2020-06-10
- 448xx: 2020-06-10 - 2020-06-27
Green segments on the time axis indicate western galactic viewing directions, with the SEP marked with a green triangle.
Page prepared by M. Freyberg using CCMC list of Earth-detected CMEs, HELCATS-WP2 otherwise, and ISWA web tool.