
This page contains the accompanying data and visualisations of the spectral analysis of the eRASS1 diffuse soft X-ray background presented in Yeung et al. (2024), Ponti et al., in prep. and Yeung et al., in prep.
As an overview, ~2000 eRASS1 X-ray background spectra were extracted, covering most of the western Galactic hemisphere, except regions of bright sources and large galaxy clusters.
The 'contour bins' are approximately equal in signal-to-noise (~80), binned using the software contbin (Sanders 2006).
These spectra were then fitted by a combination of
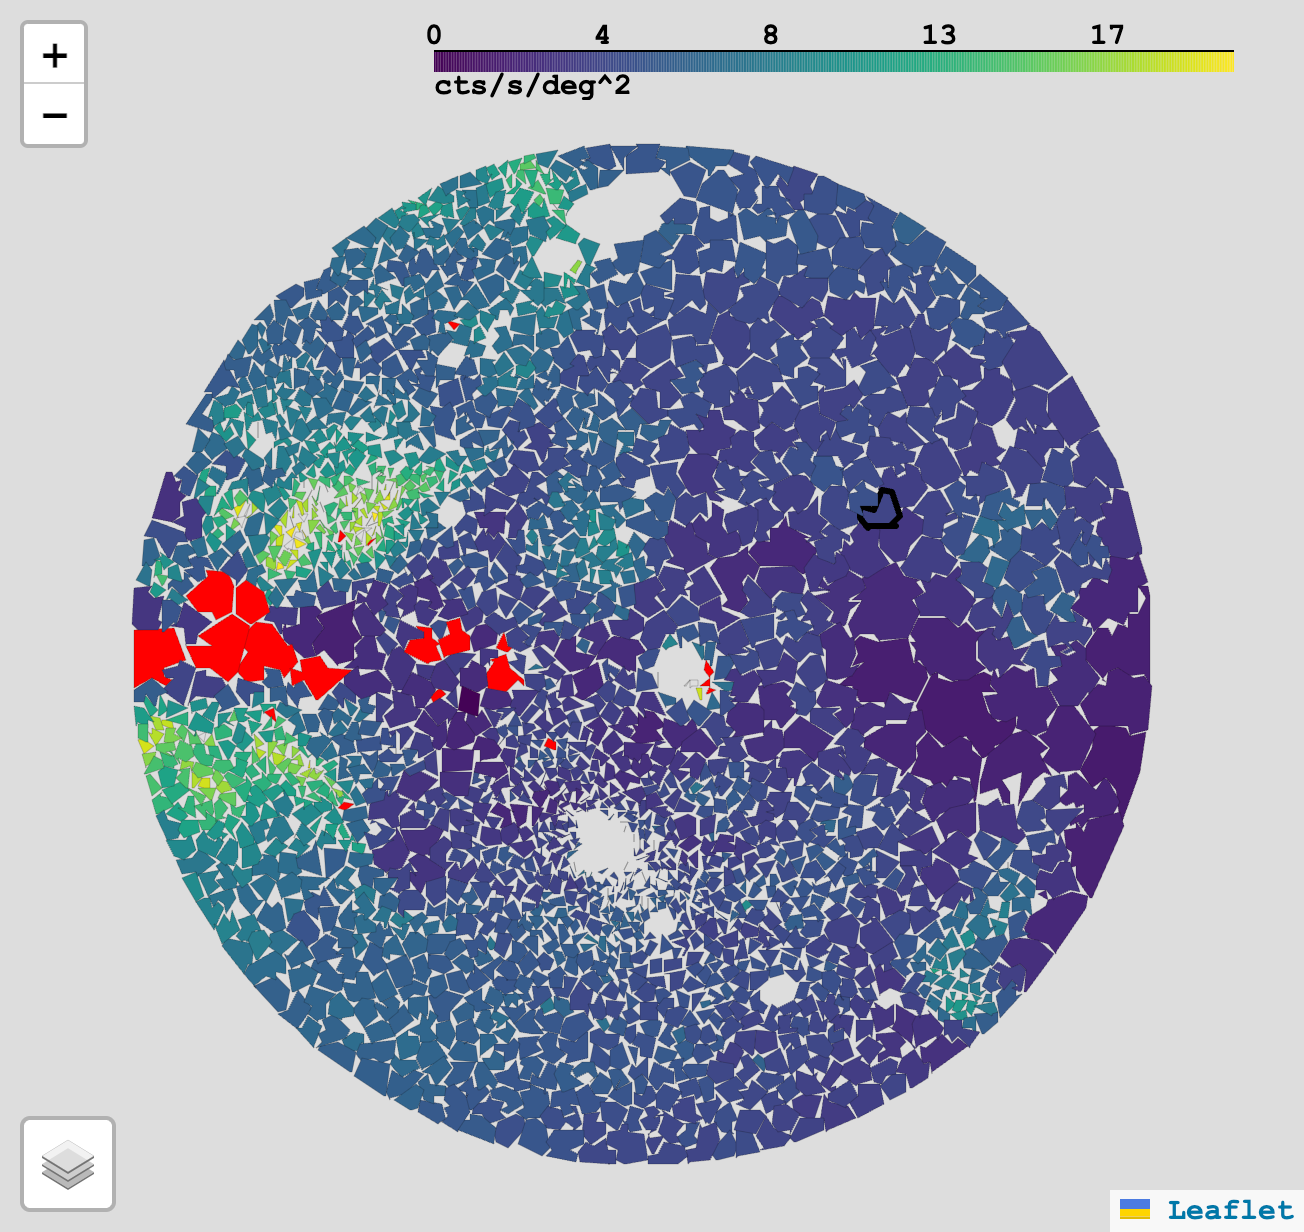
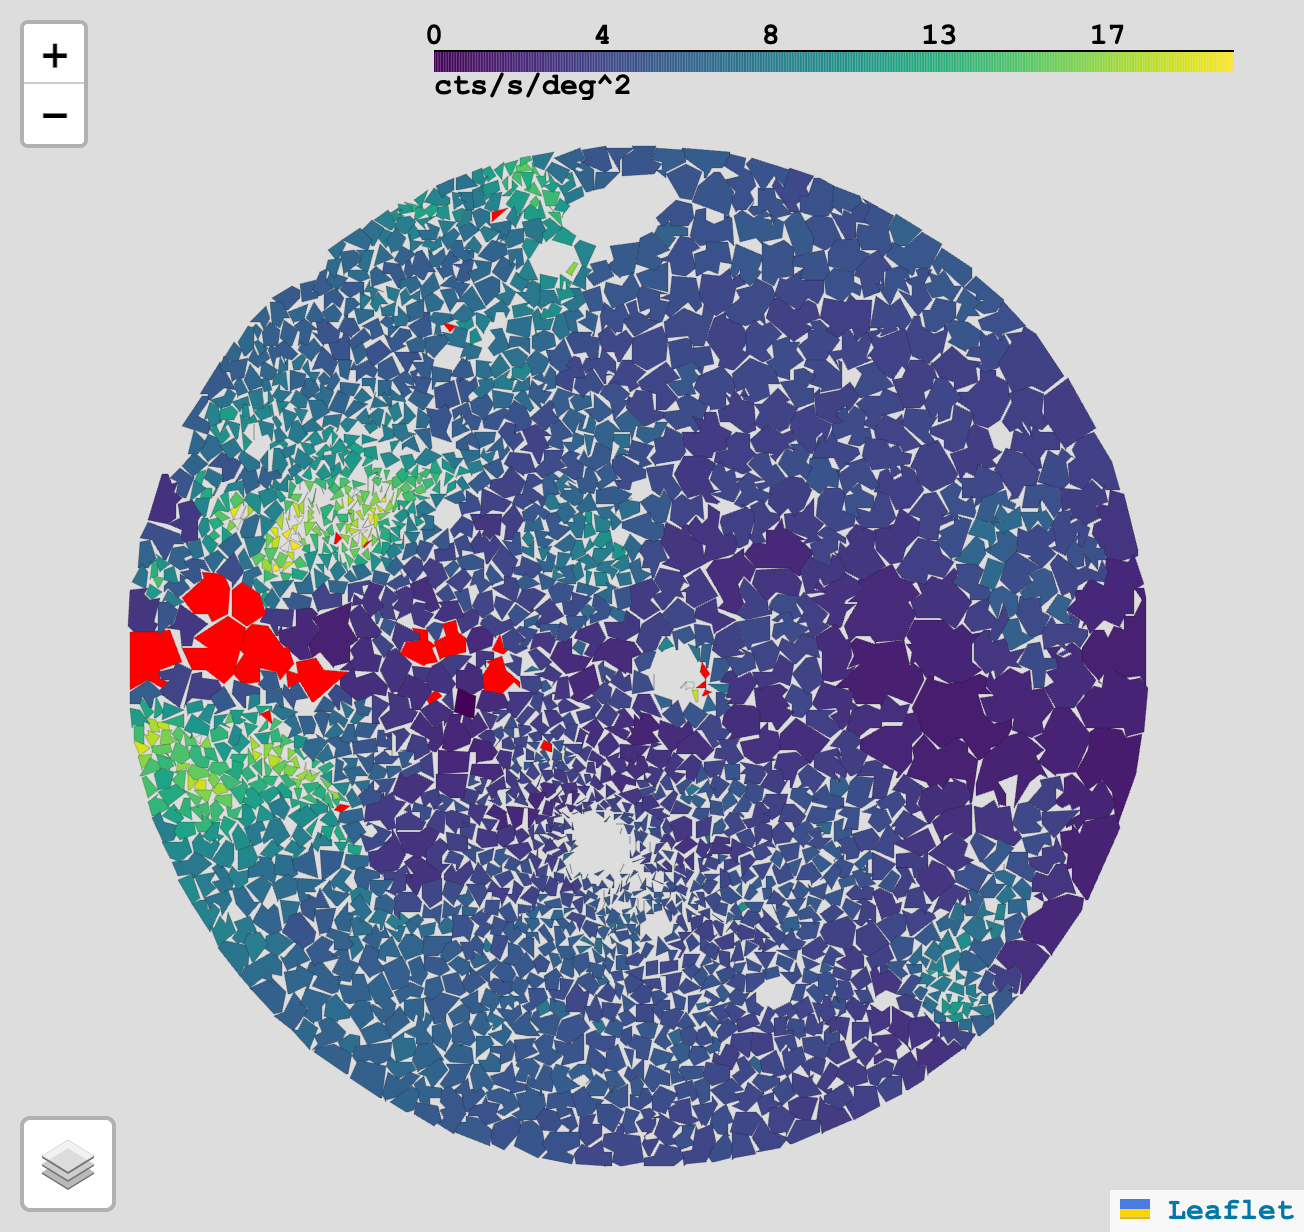
The choropleth maps below present the distributions of these parameters interactively.
Please cite the following works if you use any of the products in this page. You can also find more explanations of the products provided in the follwing works.
We present two versions of the spectral fits. They differ simply by the choice of the CXB model.
Take the simple power-law if you are unsure. They do not differ significantly for most components except for the LHB.
The choropleth maps show the western Galactic hemisphere (180°< l < 360°) in zenithal equal area (ZEA) projection. The left side is towards the Galactic centre (l = 360°), and the right is towards the anti-centre (l = 180°).
You can choose which parameters to display using the button at the bottom left corner of the maps.
A particularly important one is the 'Markers' button. Upon clicking, each 'contour bin' will show a clickable marker, where you can find a figure of the fitted spectrum, the fit parameters and links to its corresponding corner plot, steps plot and Xspec model file (.xcm).
WARNING! The choropleth maps are large HTML files (300+MB) due to many polygon vertices. They will take a while to load (~1min).
| Simple power-law CXB |
Broken power-law CXB |
|---|---|
 |
 |
Under the assumption of a constant density (we assume ne = 4×10⁻³ cm-3), one can convert the emission measure into the extent of the LHB.
Here, we plot the ±1σ uncertainty surfaces. The most probable extent of the LHB lies between the two surfaces. We also show our LHB temperature measurement on the lower error surface of the LHB.
The coloured points (except for the Sun) show the shape of the (neutral) local bubble (LB) traced by dust extinction. They are taken from the works of Lallement et al. (2022), Edenhofer et al. (2024) and O'Neill et al. (2024). Click the legend entries to toggle their visibility.
Lallement et al. (2022) and Edenhofer et al. (2024) provide two versions of 3D dust cubes. We infer the LB extent from them by finding the distance where the integration up to a column density of 1020cm-2 is reached (~1 optical depth for a 0.2 keV photon) — the plot labels distances found in this way as Lallement+22 and Edenhofer+23.
O'Neill et al. (2024) take the Edenhofer et al. (2024) dust cube and define the LB boundary as the first prominent peak in the line-of-sight dust extinction profile.
The figure below (click to redirect to the interactive version) shows the shape of the LHB in the western Galactic hemisphere along with the dust and nearby structures in the solar neighbourhood.

We provide the bin map used in the analysis and the fitted parameters in FITS files.
The bin map is contained in the first extension, and a binary table contains the fitted parameters in the second extension. The header contains brief descriptions of the parameters and their units.
We report all normalisation related parameters per unit solid angle. Sky and background areas of each region are also recorded, but they are only needed to understand the model normalisations in the xcm files.
The two FITS files differ in the choice of the CXB model, like the choropleth maps above.
Simple power-law CXB (7.2MB)You can access the xcm files of your interested regions intereactively from the choropleth maps above. However, if you are an expert user or want to look at and analyse a large amount of regions, you can download all of them in the tar file below.
In each xcm file, you will find five filter-wheel closed models, one for each TM. They are followed by the astrophysical background components. The normalisations of these models are not per solid angle, you can find the sky areas they correspond to in the parameter tables above.
We used the disnht (Locatelli, Ponti & Bianchi 2022) to model the spread in column density within each region. You will need to download the 'disnht_lodd.fits' from the disnht page to make the xcm files work properly.
We fitted two spherical harmonics models (dipole and lmax=6) to the LHB temperature profiles.
The files below list the values and uncertainties of the spherical harmonics complex coefficients alm.
Columns 're_alm' and 'im_alm' denote the real and complex part of the coefficient.
Columns with suffixes '_err', '_lerr', '_uerr' denote the 1σ symmetric, lower and upper uncertainties, respectively.
The SRG/eROSITA soft X-ray background. I. The local hot bubble in the western Galactic hemisphere Yeung, M. C. H., Ponti, G., Freyberg, M. J. et al., et al. 2024, A&A, 690, A399
eROSITA soft X-ray background. II.: Ponti, G., et al. 2024, A&A, in prep.
eROSITA soft X-ray background. III.: Yeung, M. C. H., Mayer, M. G. F., Strong, A., et al. 2024, A&A, in prep.
Edenhofer, G., Zucker, C., Frank. P., et al. 2024, A&A, 685, A82
HI4PI Collaboration, Ben Bekhti, N., Flöer, L., et al. 2016, A&A, 594, A116
Lallement, R., Vergely, J. L., Babusiaux, C., & Cox, N. L. J. 2022, A&A, 661, A147
Locatelli, N., Ponti, G., & Bianchi, S. 2022, A&A, 659, A118
O'Neill, T. J., Zucker, C., Goodman, A. A., & Edenhofer, G. 2024, ApJ, 973, 136
Planck Collaboration, Abergel, A., Ade, P. A. R., et al. 2014, A&A, 571, A11
Sanders, J. S. 2006, MNRAS, 371, 829
Software for visualisations:
Choropleth maps: folium
Solar neighbourhood, eROSITA bubbles: k3d-jupyter
3D LHB model: plotly